 10
10peptides
spectra
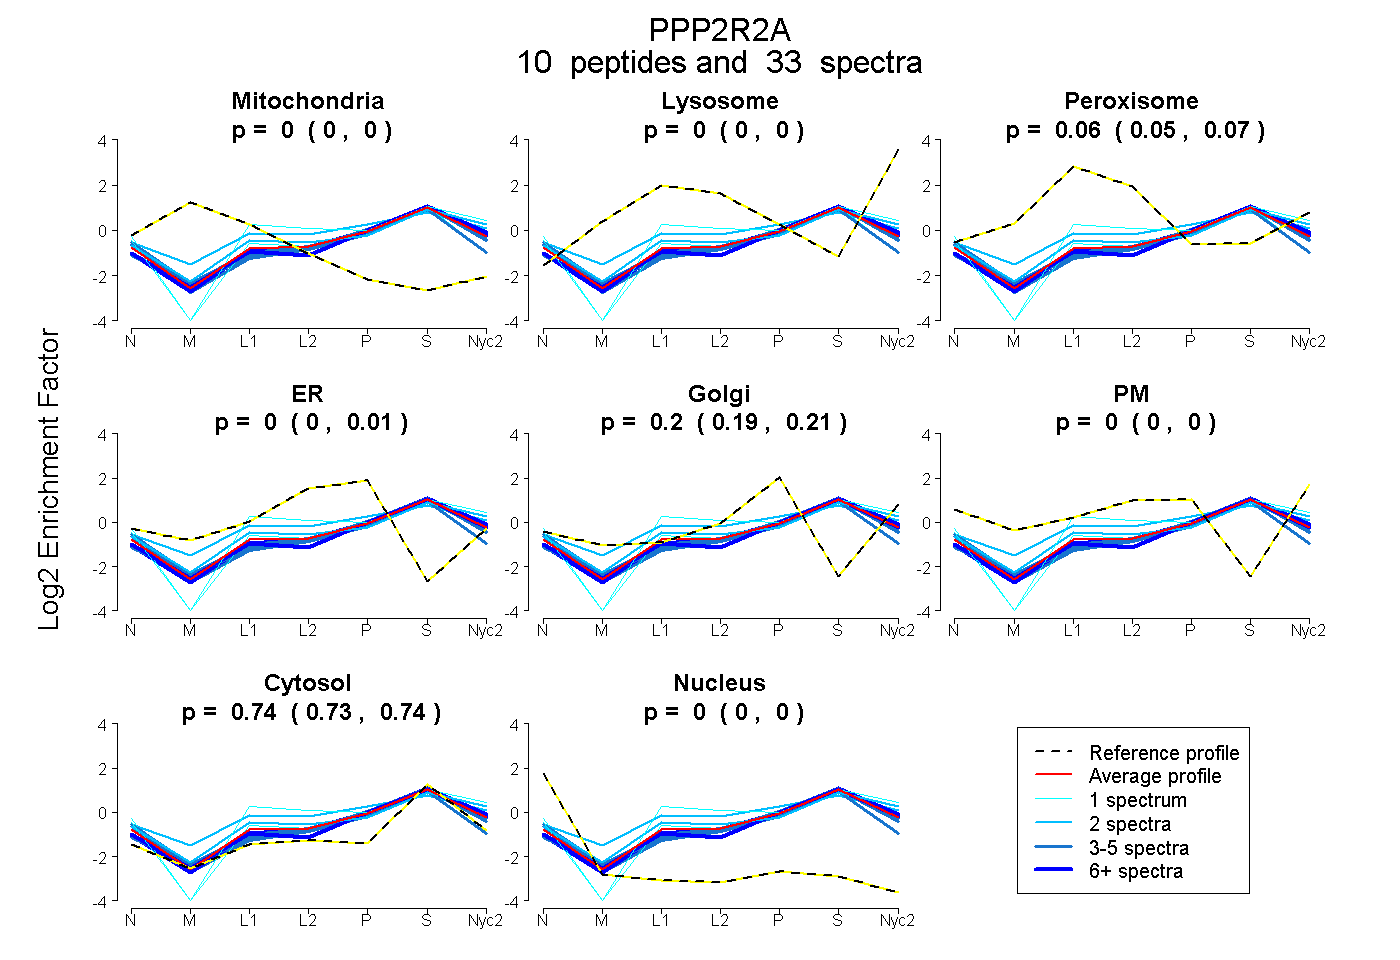
0.000 | 0.000
0.000 | 0.000
0.053 | 0.070
0.000 | 0.005
0.190 | 0.205
0.000 | 0.005
0.730 | 0.740
0.000 | 0.000
5peptides
spectra
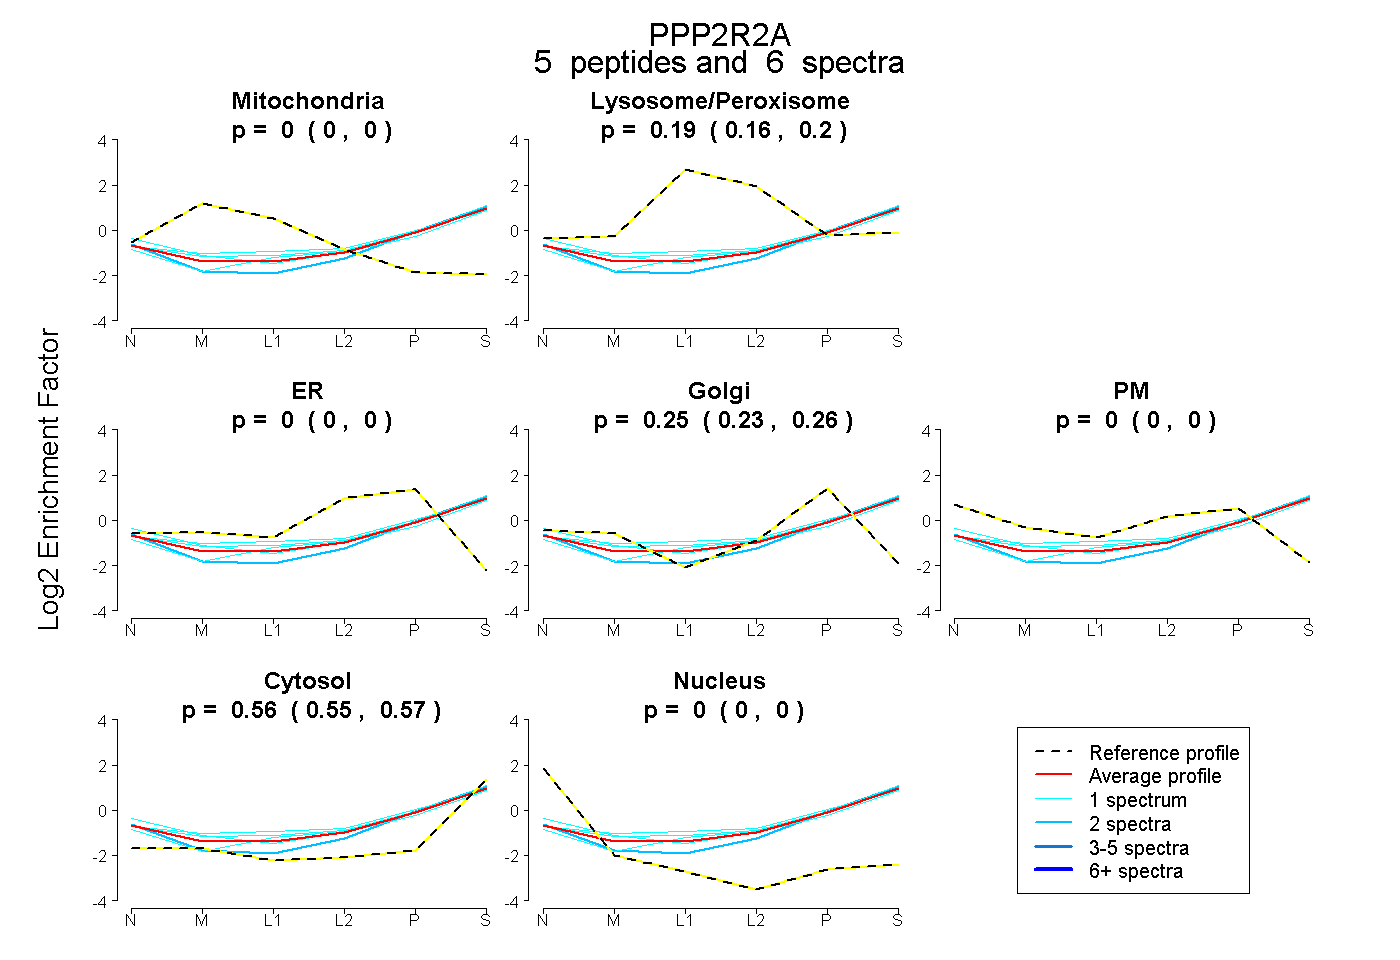
0.000 | 0.000
0.163 | 0.204
0.000 | 0.000
0.233 | 0.264
0.000 | 0.000
0.551 | 0.573
0.000 | 0.000
8peptides
spectra
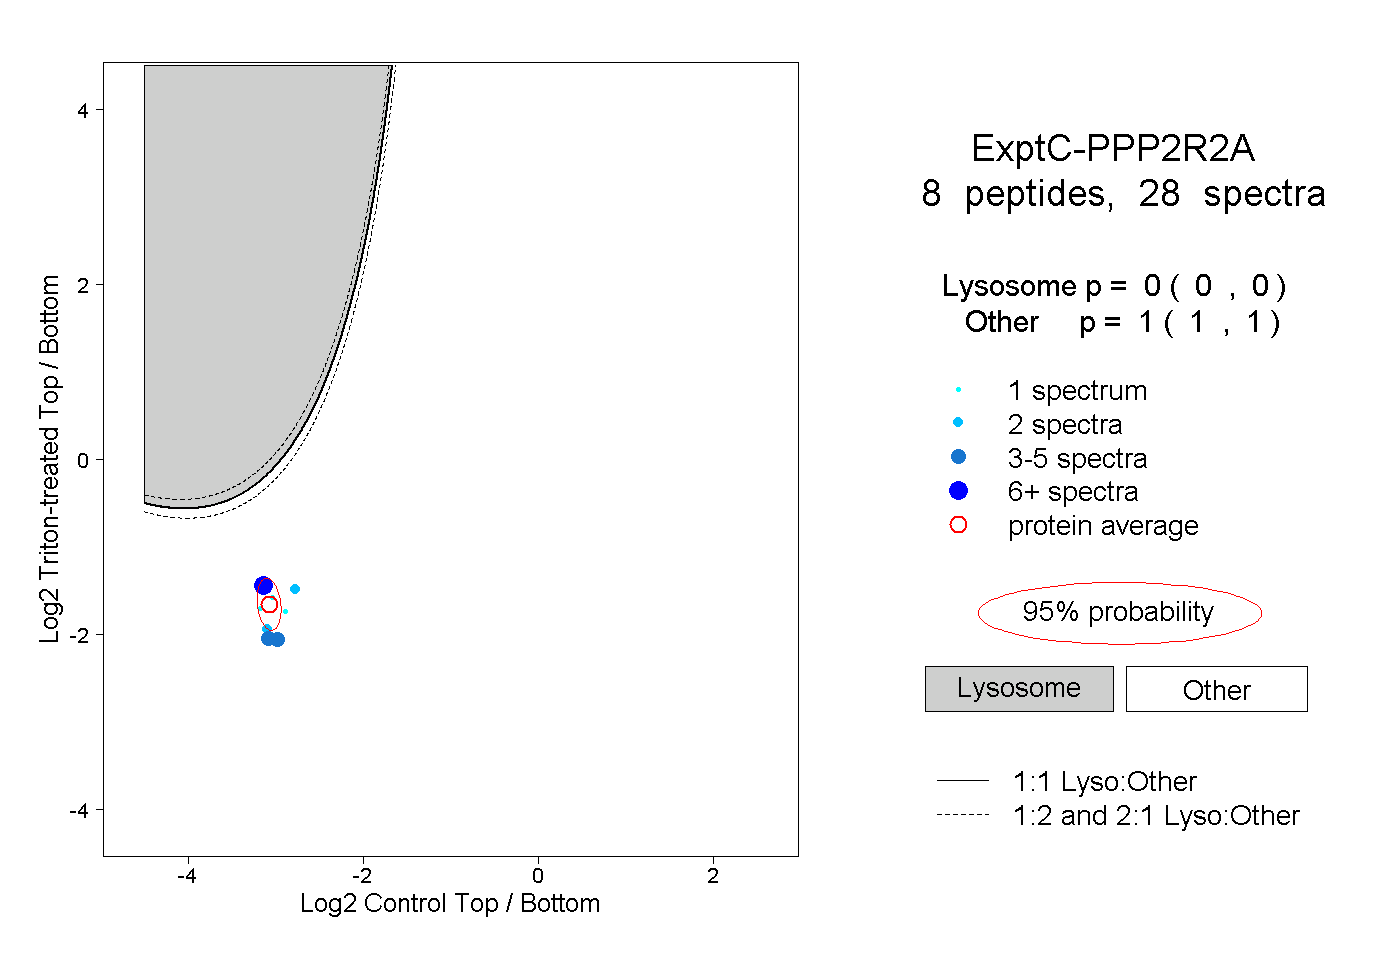
0.000 | 0.000
1.000 | 1.000