PPP2R2A
[ENSRNOP00000015318]
Main page
| | | Plot |
Mito |
Lyso |
|
Perox |
ER |
Golgi |
PM |
Cytosol |
Nucleus |
|
| Expt A |
 10
10
peptides |
33
spectra |
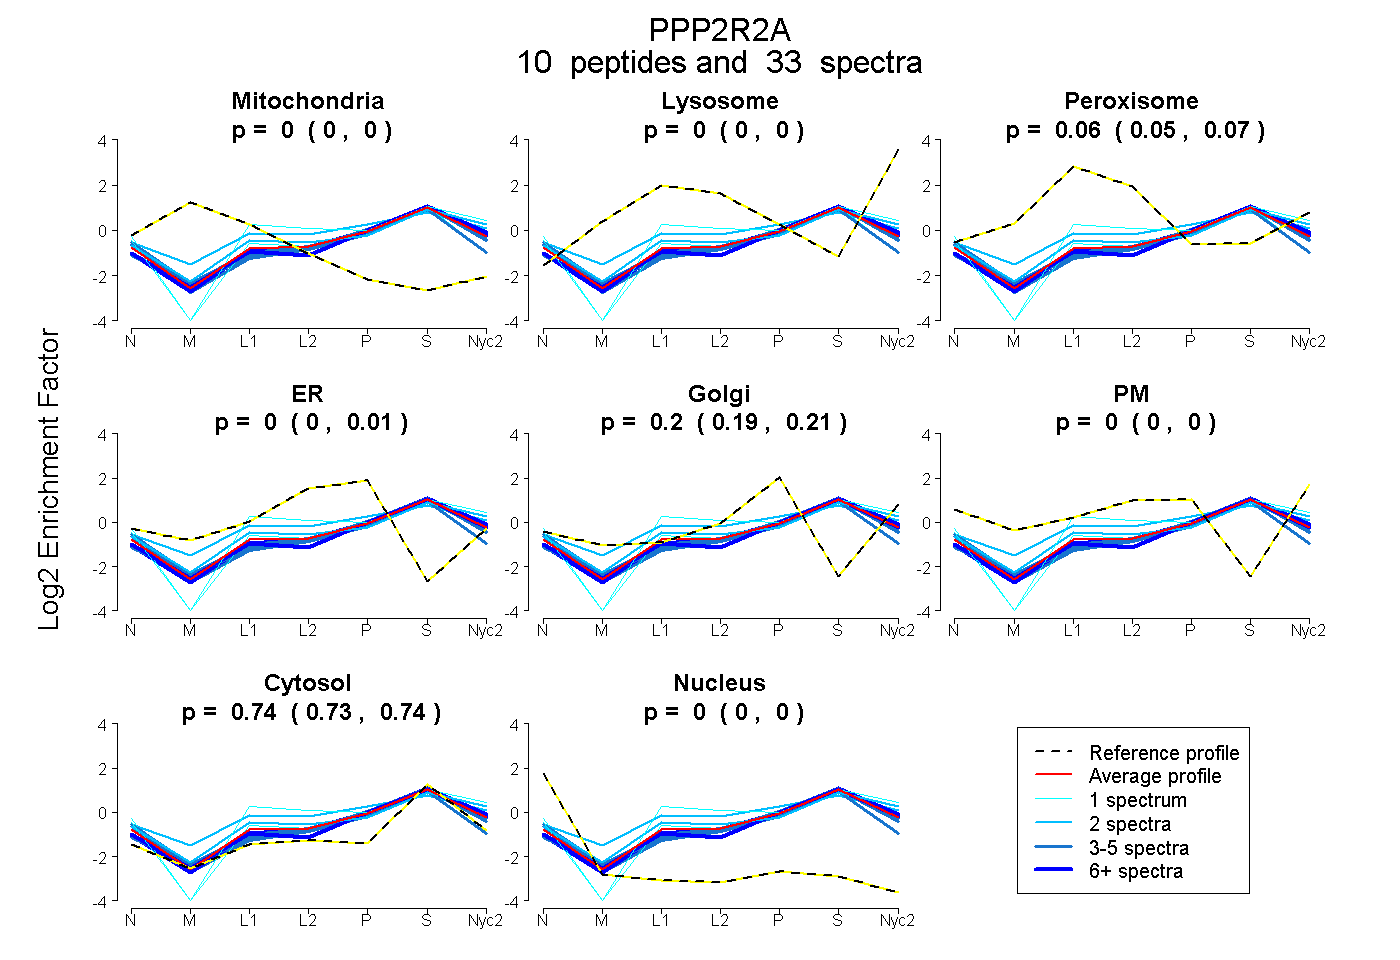 |
0.000
0.000 | 0.000 |
0.000
0.000 | 0.000 |
|
0.063
0.053 | 0.070 |
0.000
0.000 | 0.005 |
0.202
0.190 | 0.205 |
0.000
0.000 | 0.005 |
0.735
0.730 | 0.740 |
0.000
0.000 | 0.000 |
|
| | | Plot |
Mito |
|
Lyso or Perox |
|
ER |
Golgi |
PM |
Cytosol |
Nucleus |
|
| Expt B |
5
peptides |
6
spectra |
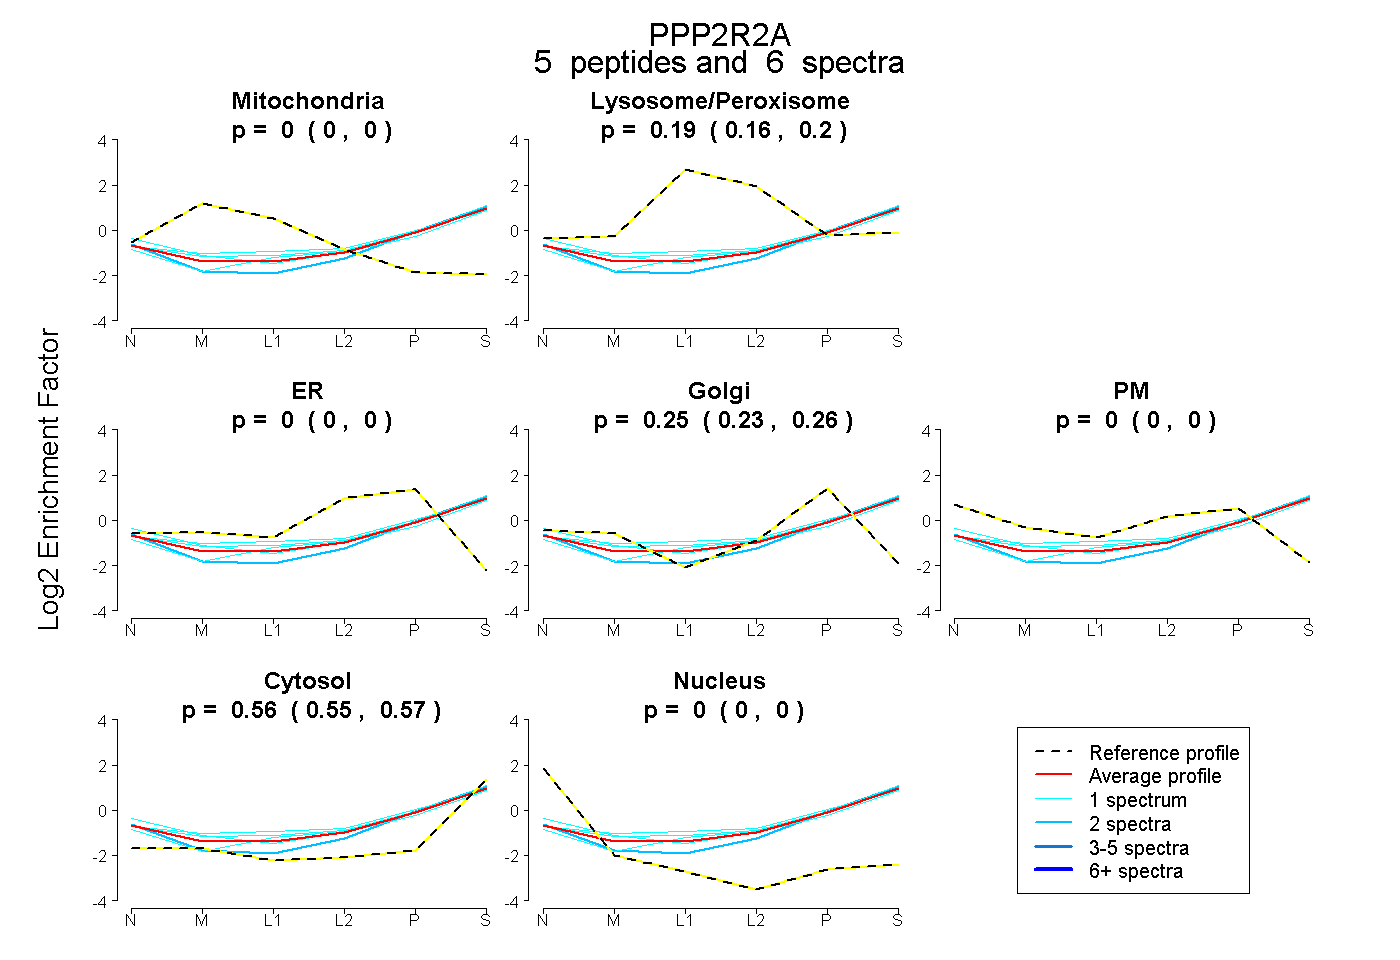 |
0.000
0.000 | 0.000 |
|
0.186
0.163 | 0.204 |
|
0.000
0.000 | 0.000 |
0.251
0.233 | 0.264 |
0.000
0.000 | 0.000 |
0.563
0.551 | 0.573 |
0.000
0.000 | 0.000 |
|
| 1 spectrum, INLWHLEITDR |
0.000 |
|
0.260 |
|
0.000 |
0.245 |
0.000 |
0.495 |
0.000 |
|
| 1 spectrum, NAAQFLLSTNDK |
0.000 |
|
0.095 |
|
0.000 |
0.061 |
0.269 |
0.575 |
0.000 |
|
| 1 spectrum, ILHTAWHPK |
0.000 |
|
0.230 |
|
0.000 |
0.240 |
0.000 |
0.531 |
0.000 |
|
| 1 spectrum, VVIFQQEQENK |
0.000 |
|
0.205 |
|
0.000 |
0.194 |
0.000 |
0.600 |
0.000 |
|
| 2 spectra, DITLEASR |
0.000 |
|
0.081 |
|
0.000 |
0.289 |
0.000 |
0.630 |
0.000 |
|
| | | Plot |
|
Lyso |
|
|
|
|
|
|
|
Other |
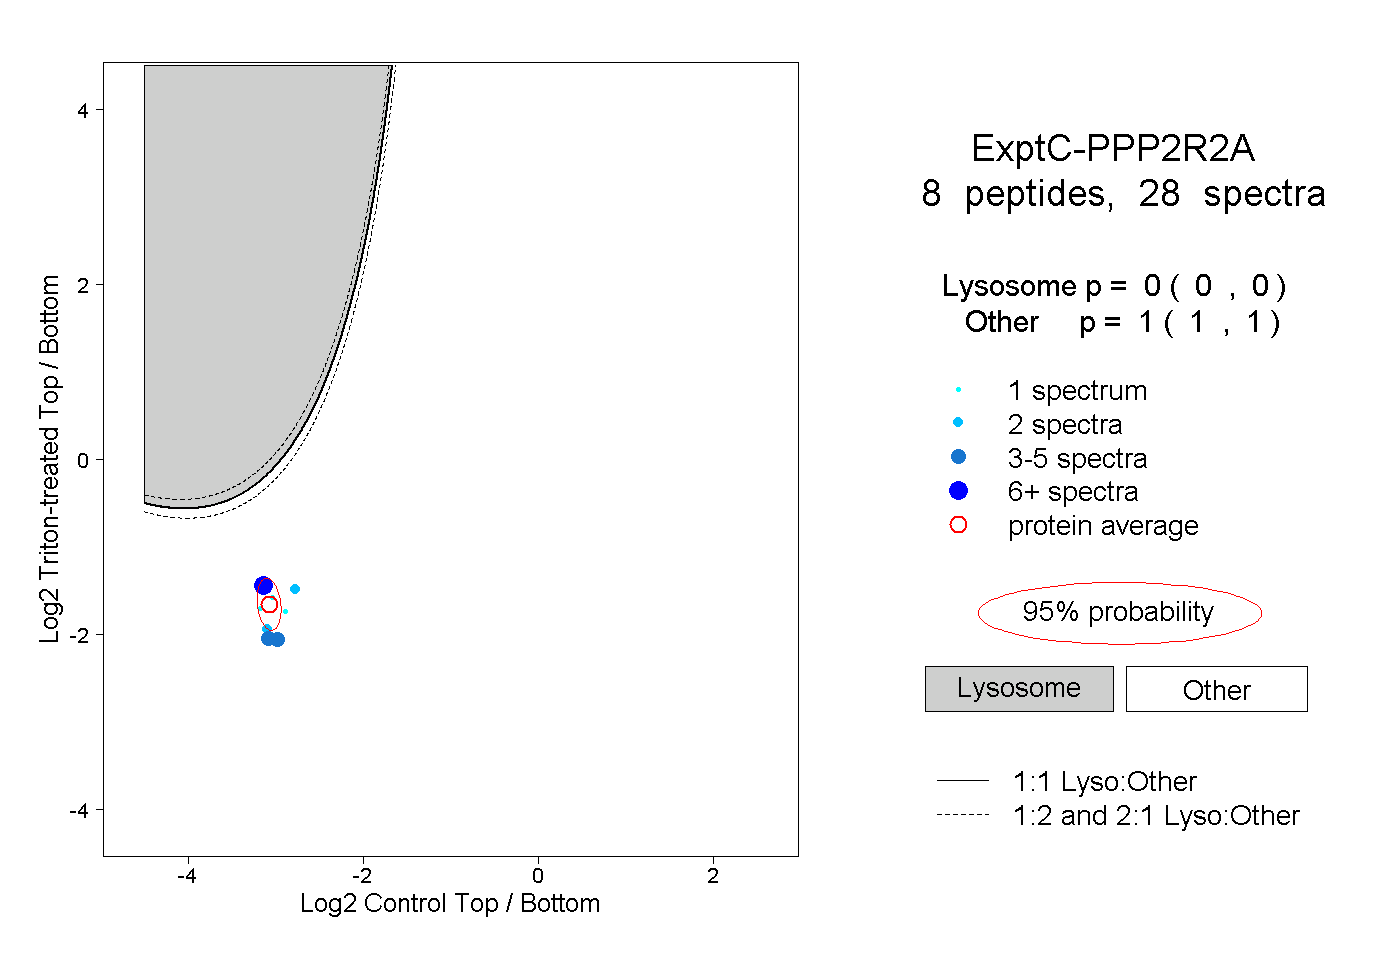
| Expt C |
8
peptides |
28
spectra |
 |
|
0.000
0.000 | 0.000 |
|
|
|
|
|
|
|
1.000
1.000 | 1.000 |