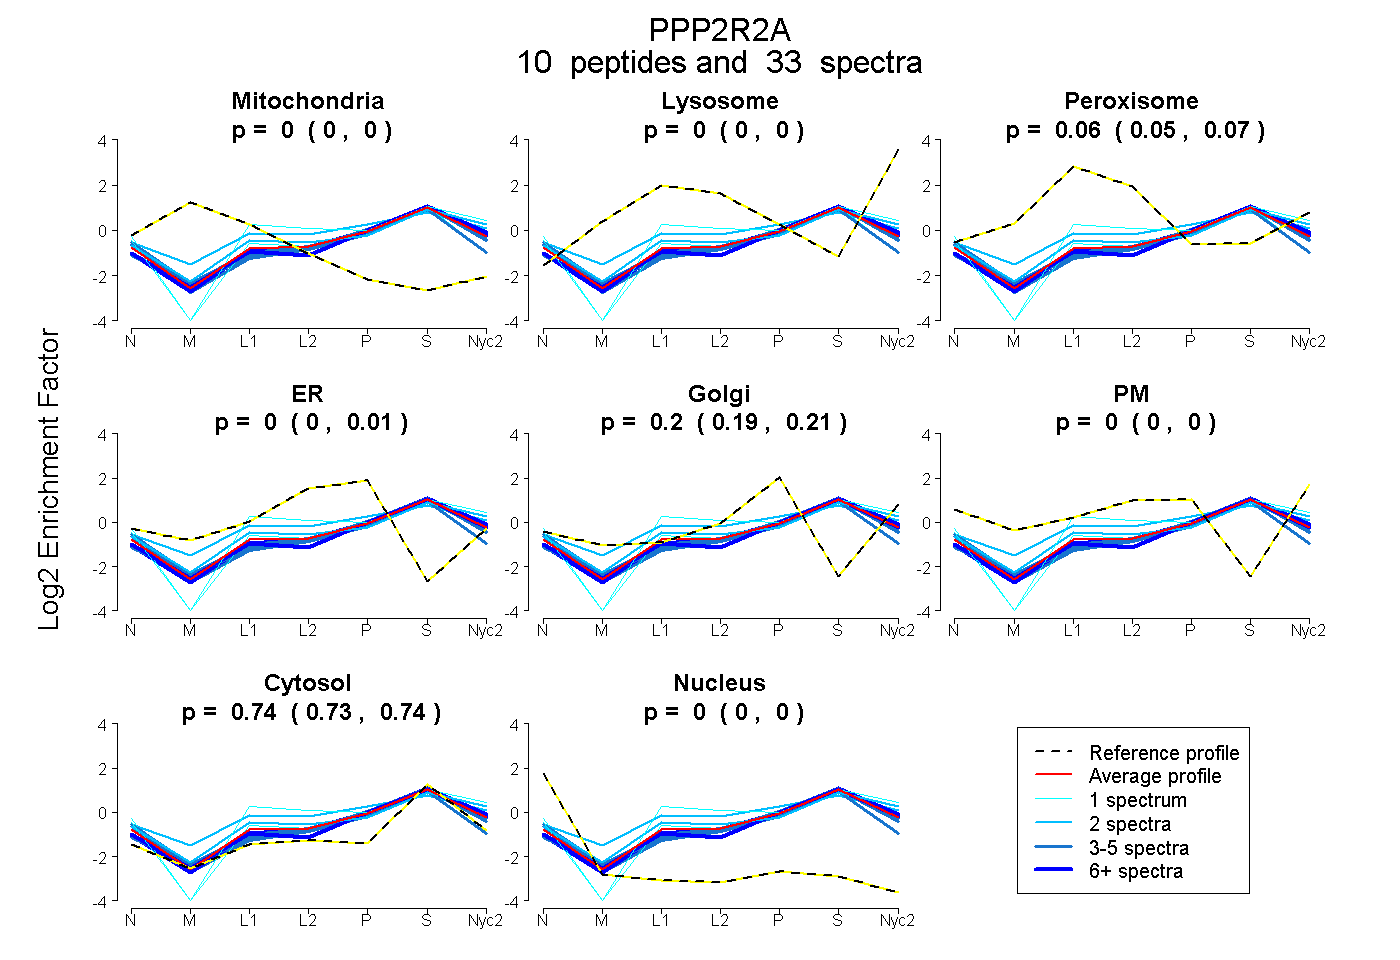
 10
10peptides
spectra
0.000 | 0.000
0.000 | 0.000
0.053 | 0.070
0.000 | 0.005
0.190 | 0.205
0.000 | 0.005
0.730 | 0.740
0.000 | 0.000
| Plot | Mito | Lyso | Perox | ER | Golgi | PM | Cytosol | Nucleus | |||||
| Expt A |
10 peptides |
33 spectra |
|
0.000 0.000 | 0.000 |
0.000 0.000 | 0.000 |
0.063 0.053 | 0.070 |
0.000 0.000 | 0.005 |
0.202 0.190 | 0.205 |
0.000 0.000 | 0.005 |
0.735 0.730 | 0.740 |
0.000 0.000 | 0.000 |
| 3 spectra, LFEEPEDPSNR | 0.000 | 0.000 | 0.000 | 0.008 | 0.121 | 0.106 | 0.765 | 0.000 | ||
| 3 spectra, SLEIEEK | 0.000 | 0.000 | 0.000 | 0.218 | 0.000 | 0.000 | 0.782 | 0.000 | ||
| 6 spectra, VPVFRPMDLMVEASPR | 0.000 | 0.022 | 0.000 | 0.000 | 0.206 | 0.000 | 0.772 | 0.000 | ||
| 9 spectra, ILHTAWHPK | 0.000 | 0.049 | 0.000 | 0.000 | 0.185 | 0.000 | 0.766 | 0.000 | ||
| 1 spectrum, SFFSEIISSISDVK | 0.000 | 0.000 | 0.000 | 0.153 | 0.000 | 0.000 | 0.836 | 0.011 | ||
| 1 spectrum, VWDLNMENRPVETYQVHEYLR | 0.000 | 0.080 | 0.082 | 0.053 | 0.000 | 0.086 | 0.699 | 0.000 | ||
| 3 spectra, INLWHLEITDR | 0.000 | 0.001 | 0.000 | 0.025 | 0.202 | 0.000 | 0.772 | 0.000 | ||
| 2 spectra, VVIFQQEQENK | 0.000 | 0.090 | 0.021 | 0.000 | 0.000 | 0.182 | 0.707 | 0.000 | ||
| 2 spectra, ASALCDR | 0.000 | 0.000 | 0.256 | 0.000 | 0.227 | 0.000 | 0.517 | 0.000 | ||
| 3 spectra, DITLEASR | 0.000 | 0.000 | 0.000 | 0.000 | 0.197 | 0.006 | 0.797 | 0.000 |
| Plot | Mito | Lyso or Perox | ER | Golgi | PM | Cytosol | Nucleus | ||||||
| Expt B |
5 peptides |
6 spectra |
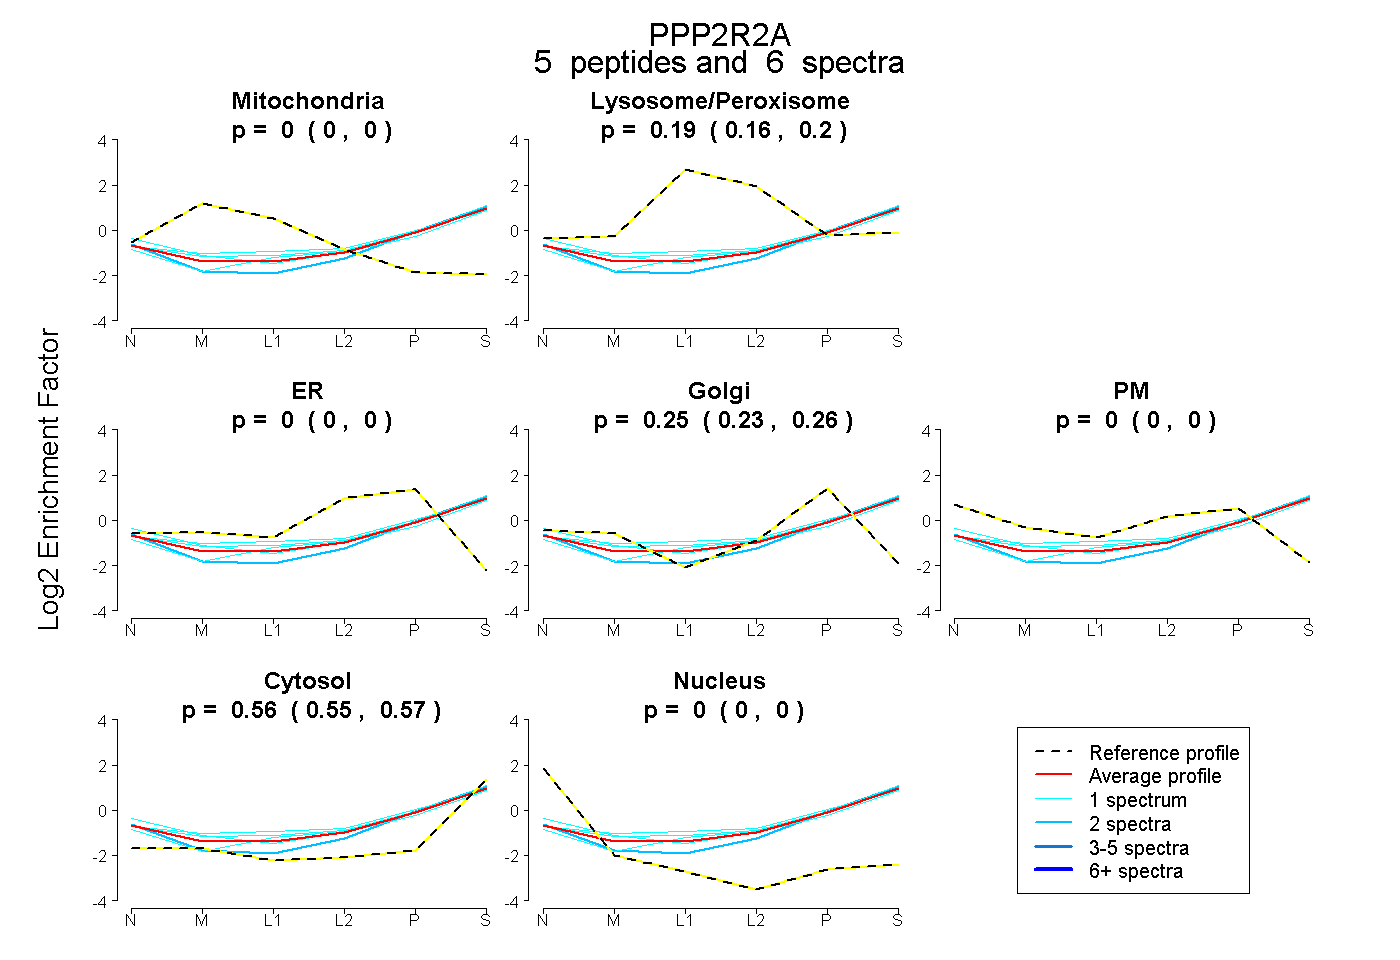 |
0.000 0.000 | 0.000 |
0.186 0.163 | 0.204 |
0.000 0.000 | 0.000 |
0.251 0.233 | 0.264 |
0.000 0.000 | 0.000 |
0.563 0.551 | 0.573 |
0.000 0.000 | 0.000 |
|||
| Plot | Lyso | Other | |||||||||||
| Expt C |
8 peptides |
28 spectra |
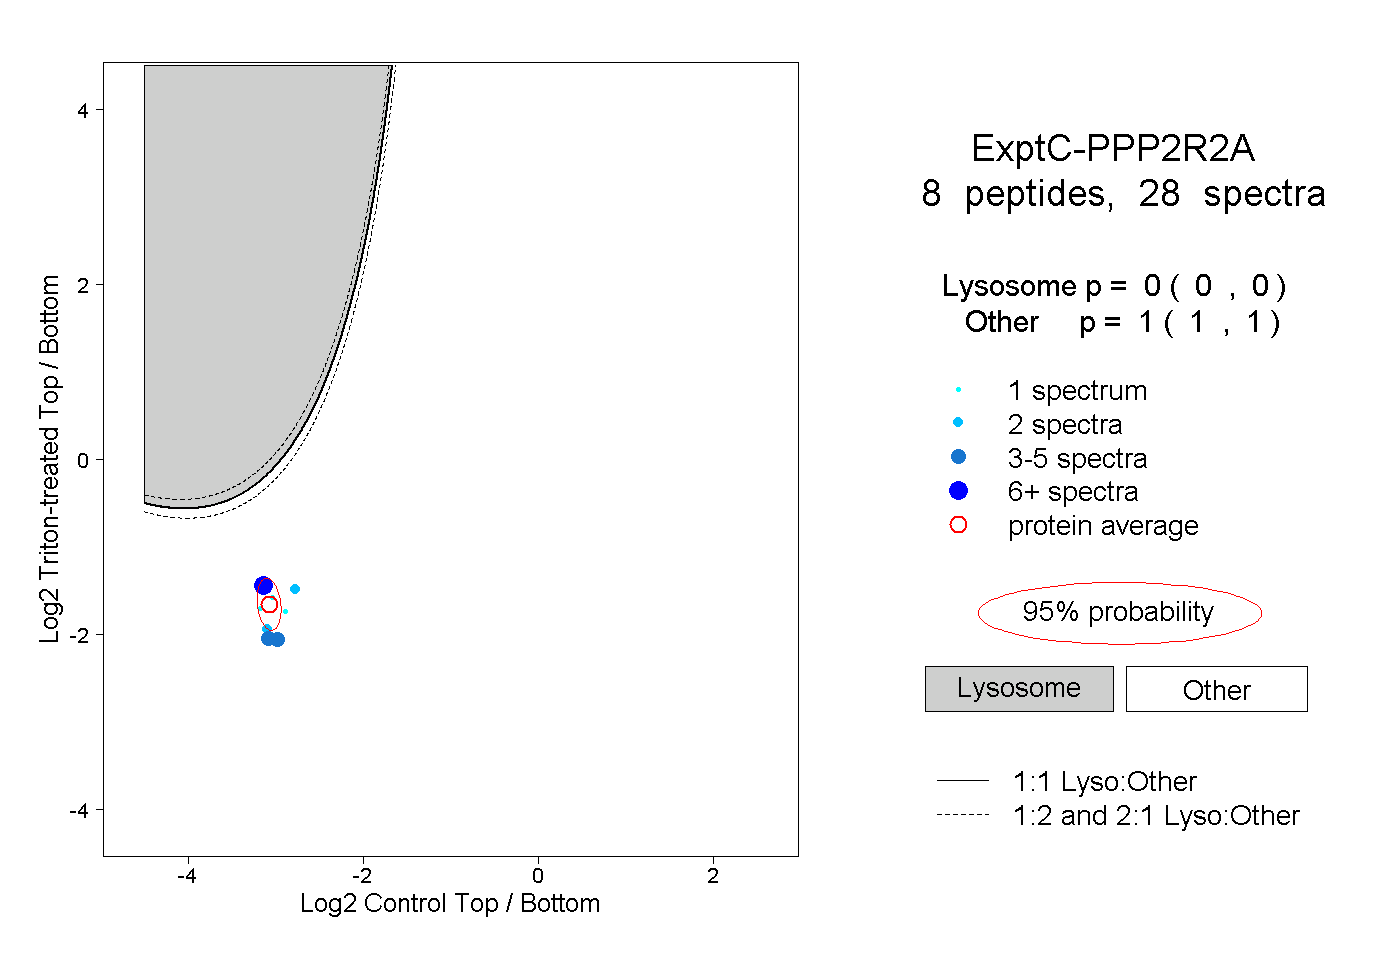 |
0.000 0.000 | 0.000 |
1.000 1.000 | 1.000 |