 5
5peptides
spectra
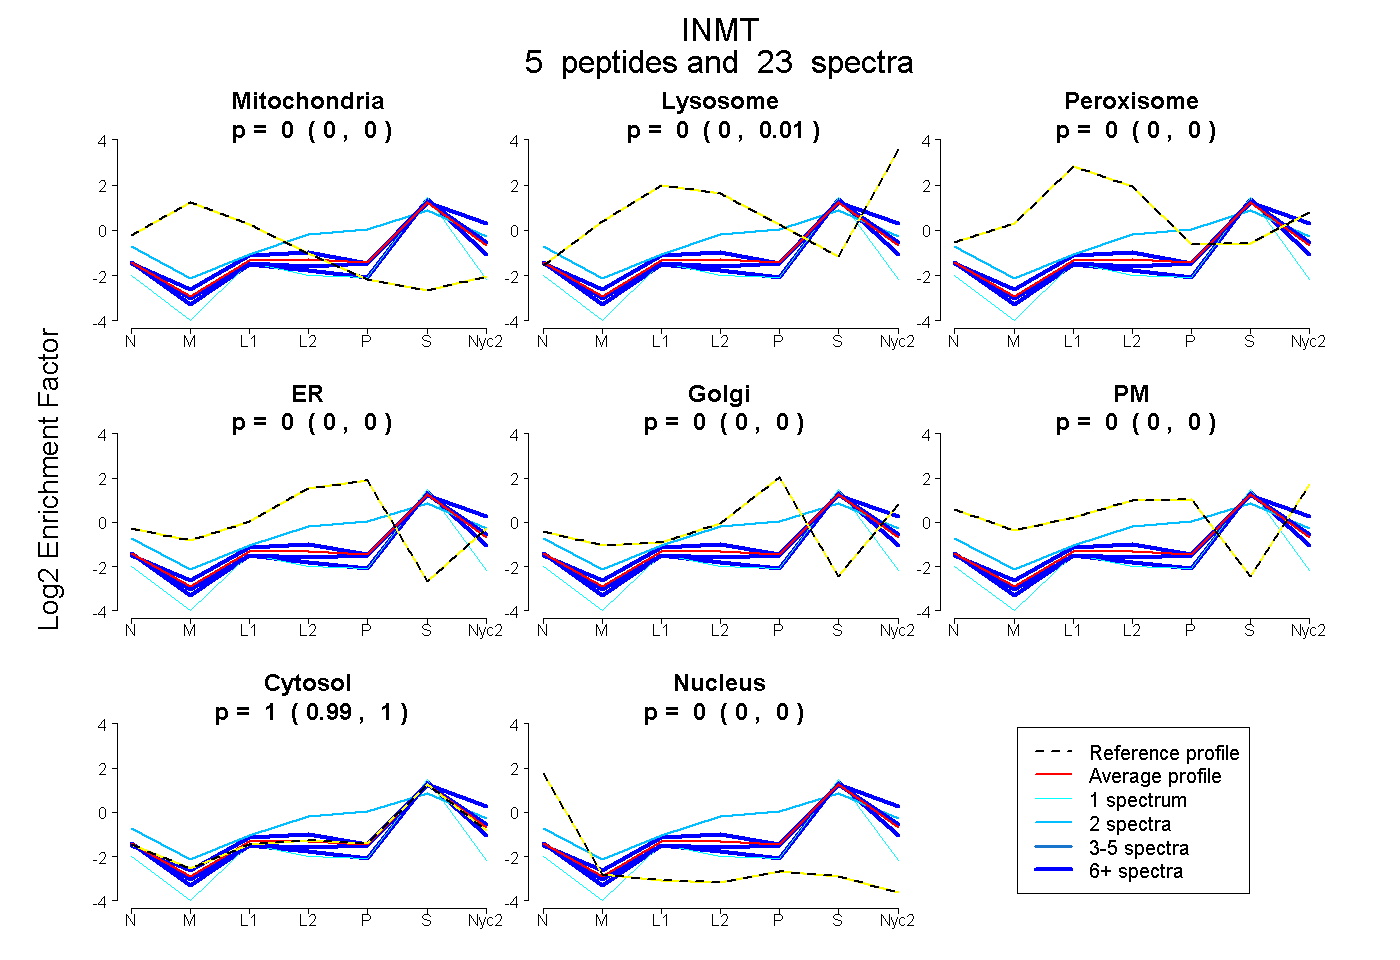
0.000 | 0.000
0.000 | 0.010
0.000 | 0.000
0.000 | 0.000
0.000 | 0.000
0.000 | 0.000
0.988 | 1.000
0.000 | 0.003
3peptides
spectra
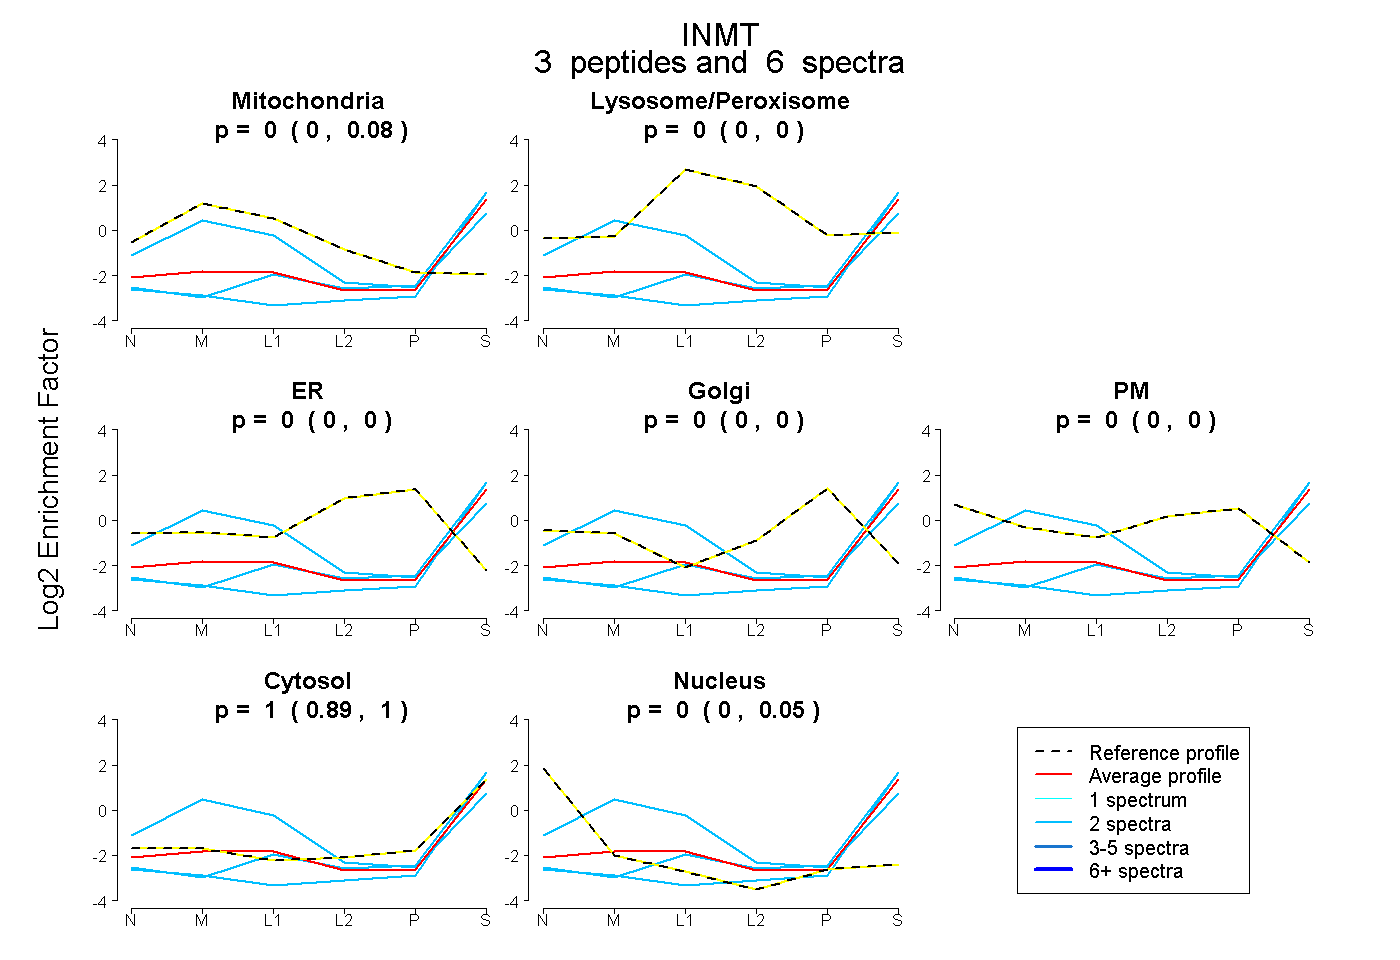
0.000 | 0.083
0.000 | 0.000
0.000 | 0.000
0.000 | 0.000
0.000 | 0.000
0.895 | 1.000
0.000 | 0.054
5peptides
spectra
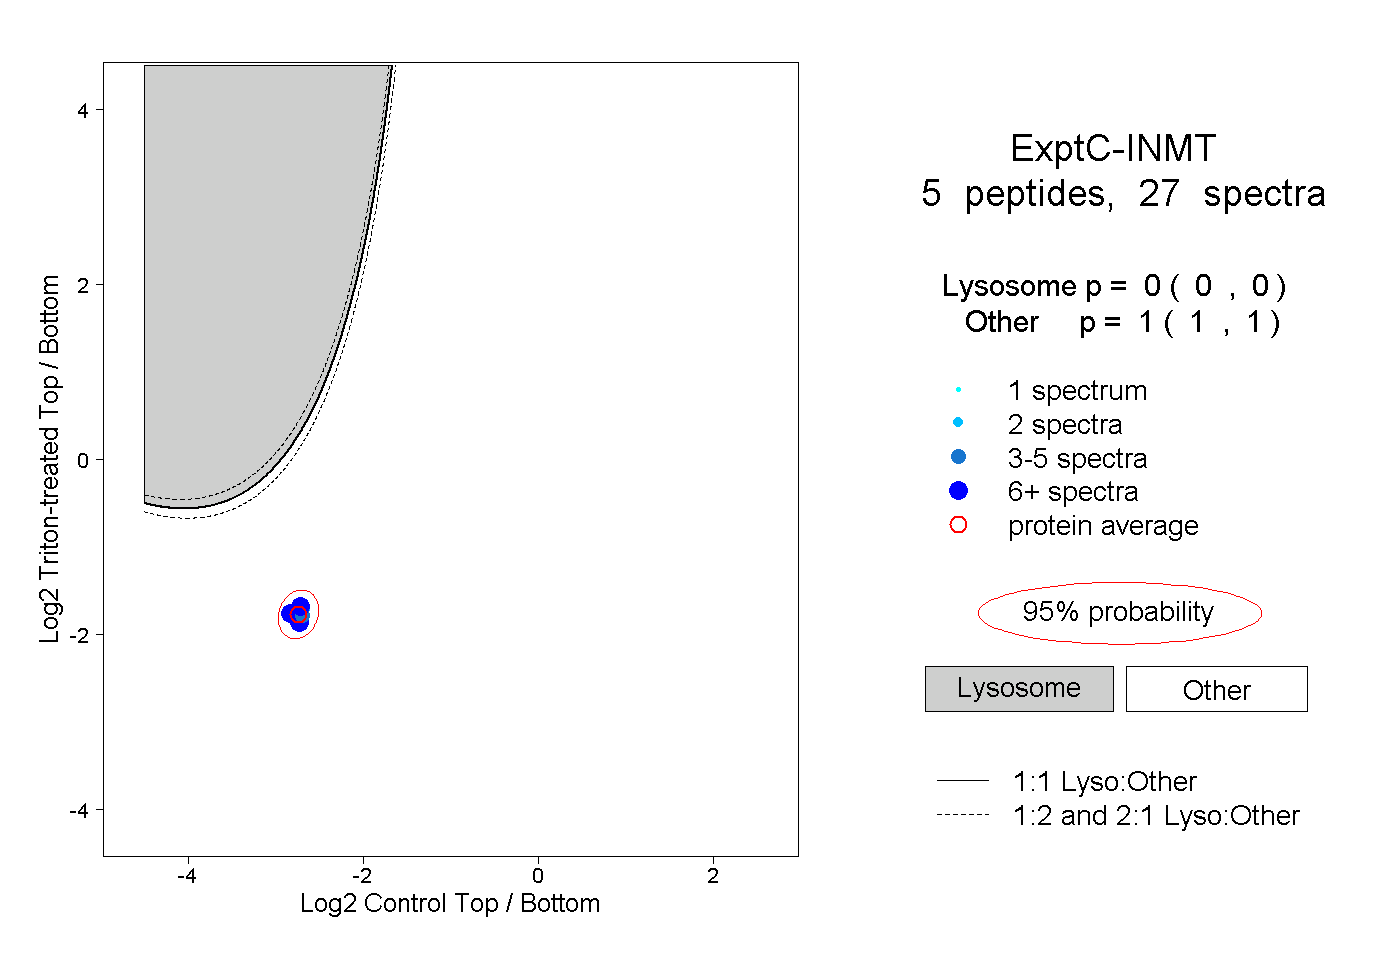
0.000 | 0.000
1.000 | 1.000
1peptide
spectra
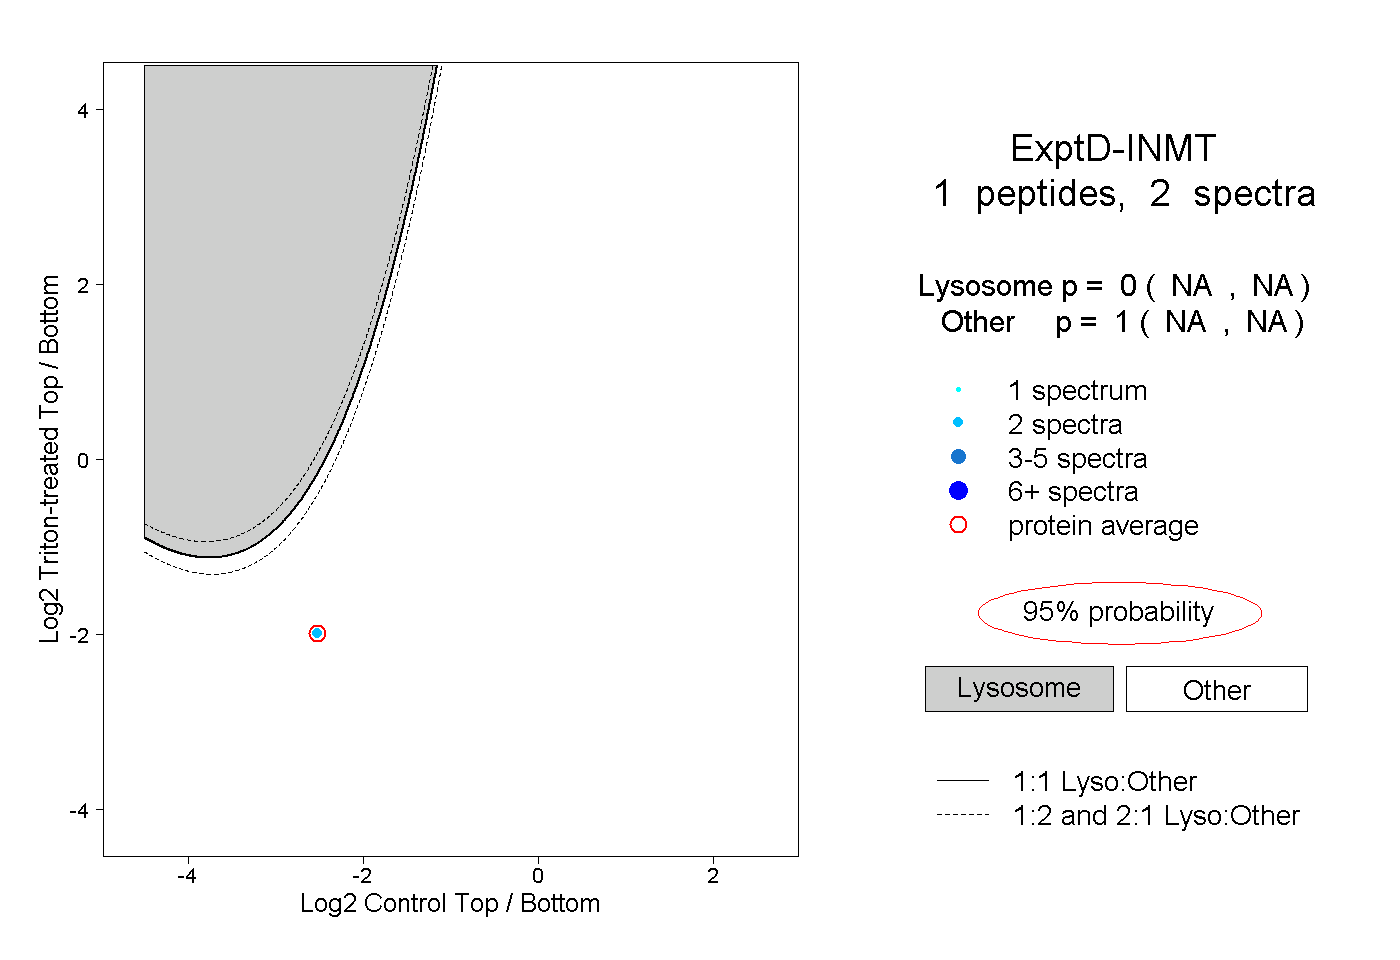
NA | NA
NA | NA