8
8peptides
spectra
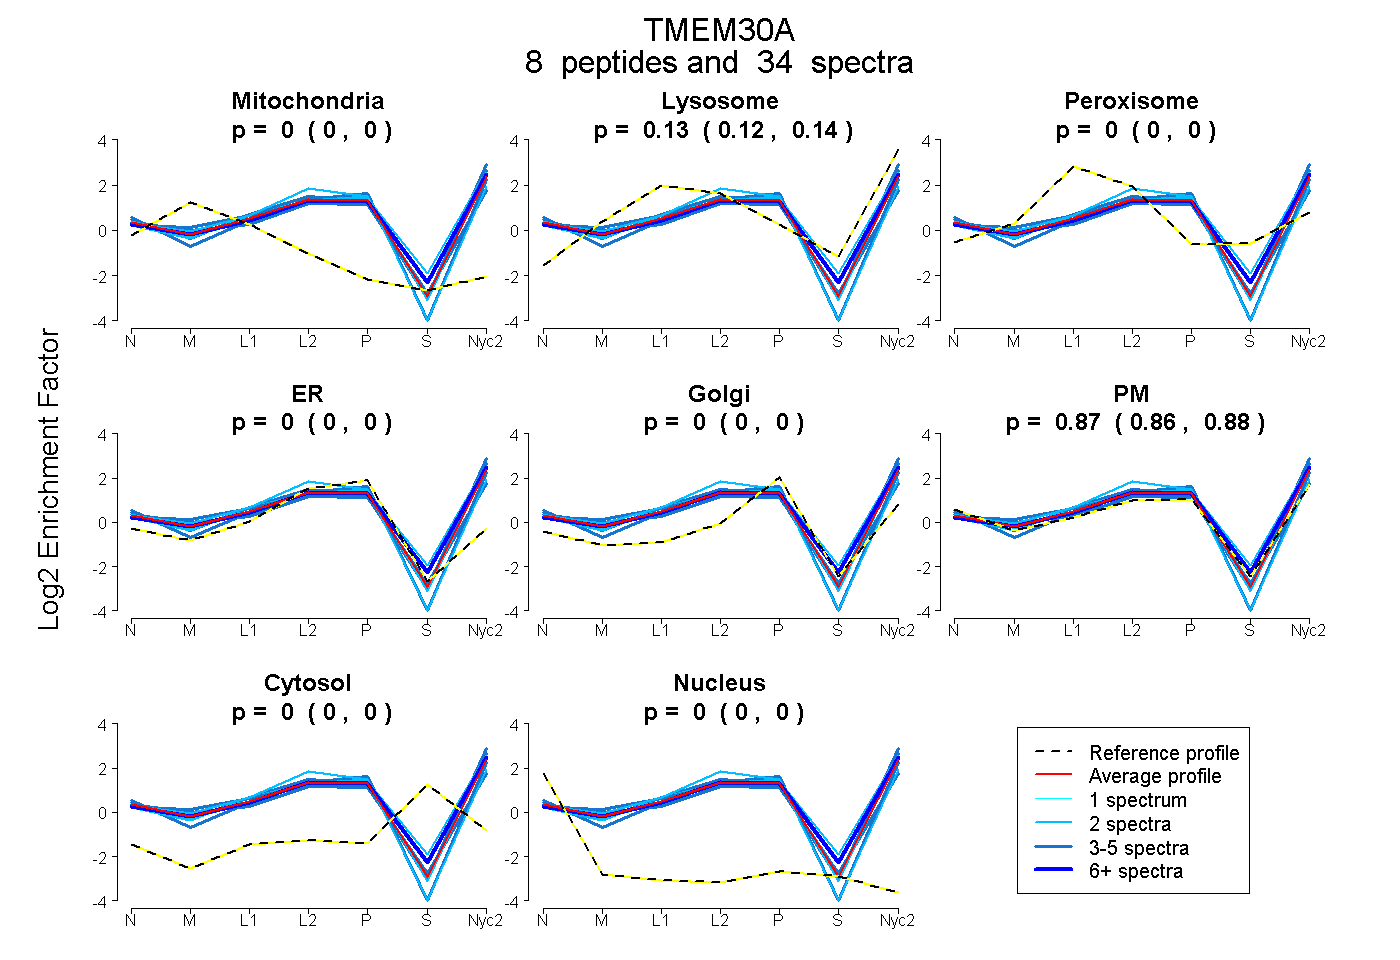
0.000 | 0.000
0.122 | 0.141
0.000 | 0.000
0.000 | 0.000
0.000 | 0.000
0.858 | 0.877
0.000 | 0.000
0.000 | 0.000
4peptides
spectra
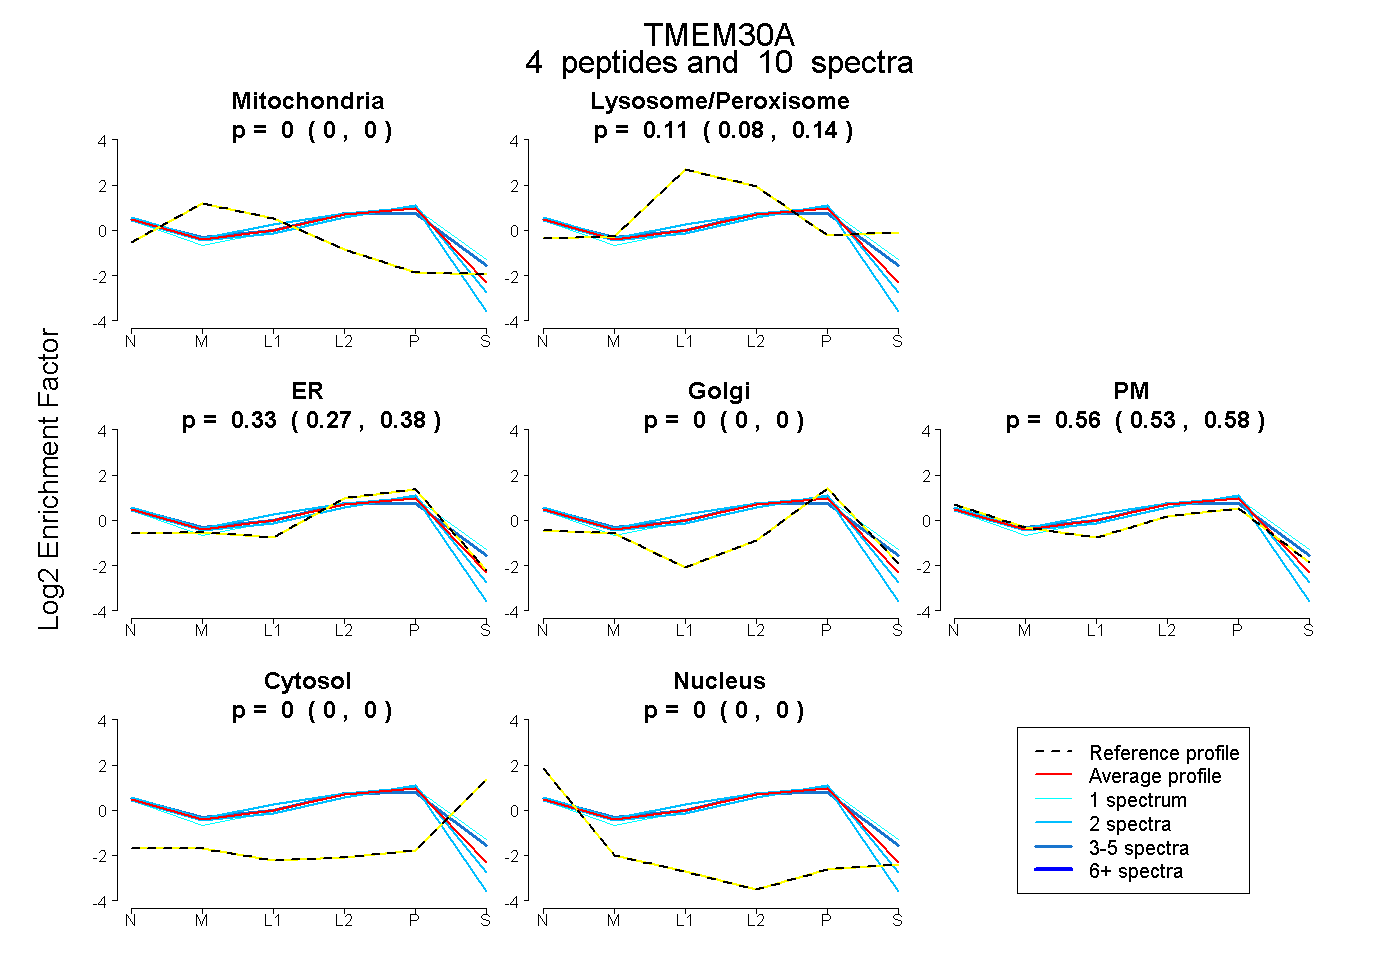
0.000 | 0.000
0.081 | 0.142
0.272 | 0.377
0.000 | 0.000
0.530 | 0.578
0.000 | 0.000
0.000 | 0.000
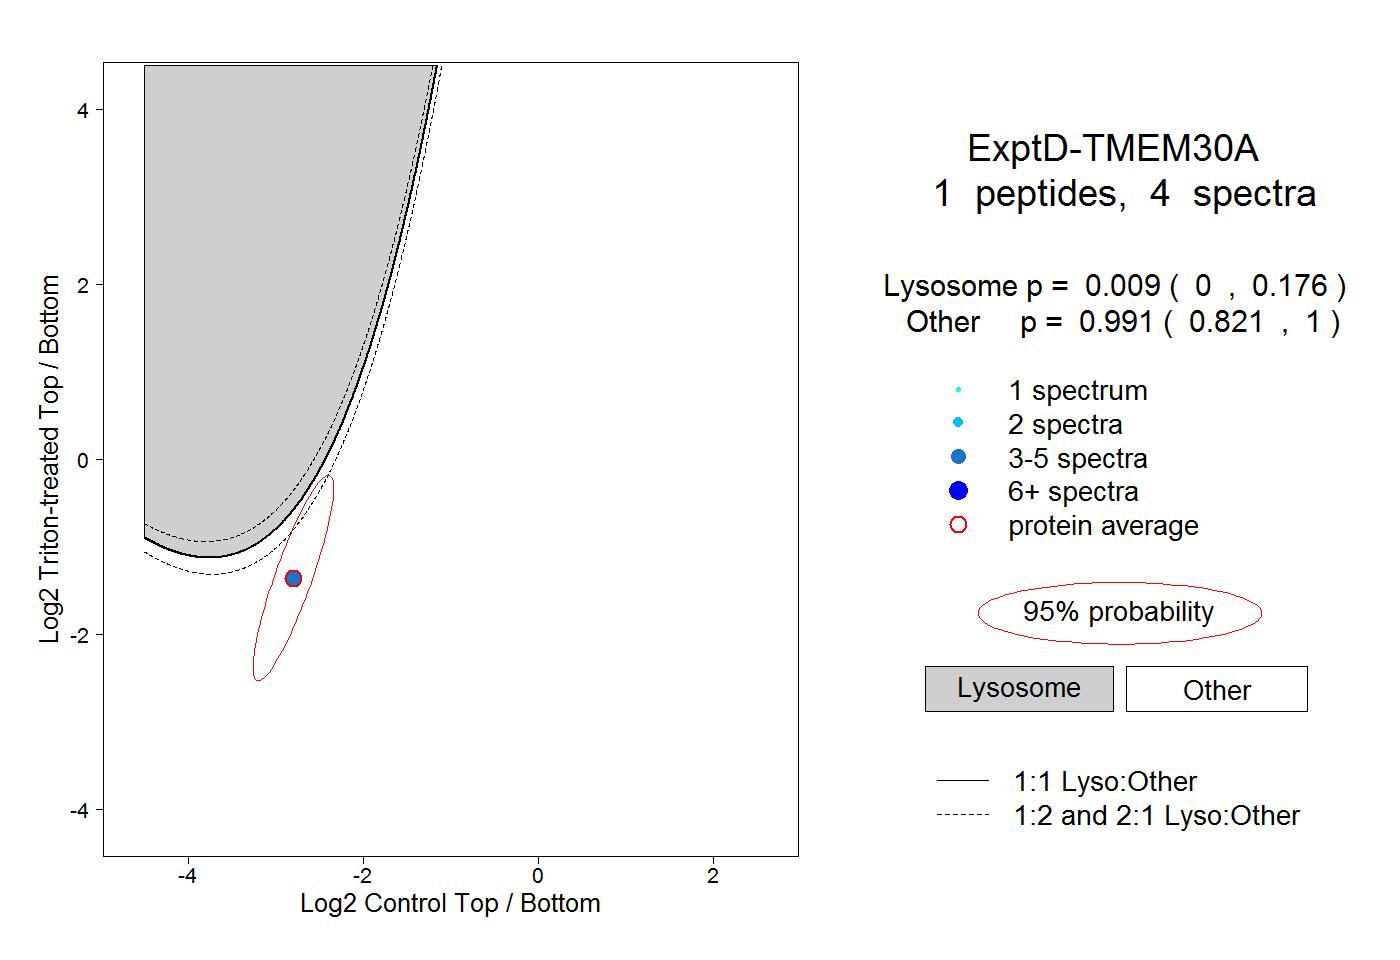
8peptides
spectra
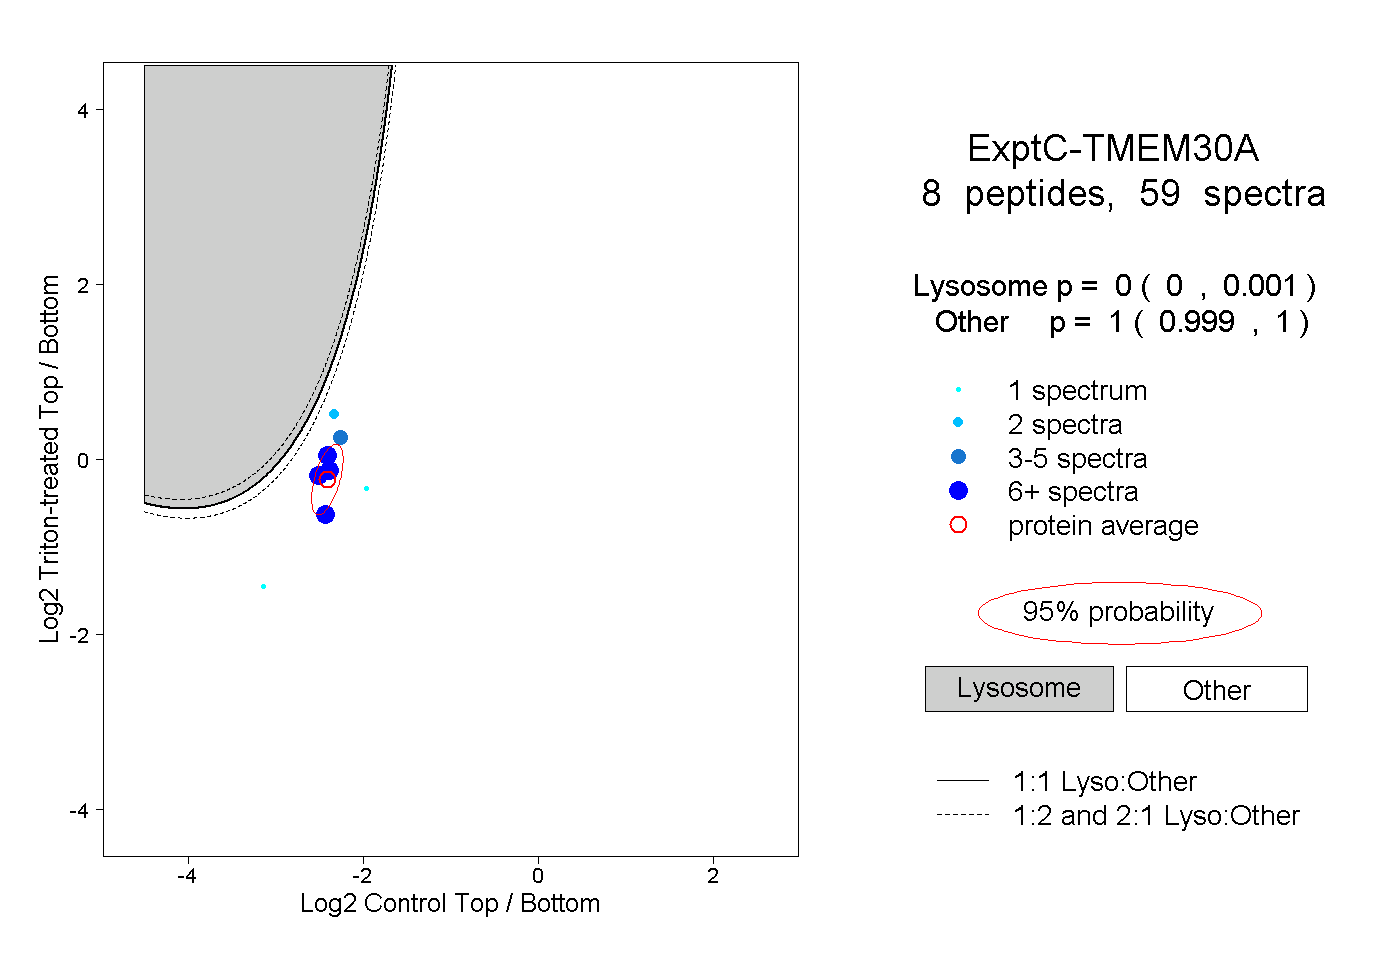
0.000 | 0.001
0.999 | 1.000