 8
8peptides
spectra
0.000 | 0.000
0.122 | 0.141
0.000 | 0.000
0.000 | 0.000
0.000 | 0.000
0.858 | 0.877
0.000 | 0.000
0.000 | 0.000
| Plot | Mito | Lyso | Perox | ER | Golgi | PM | Cytosol | Nucleus | |||||
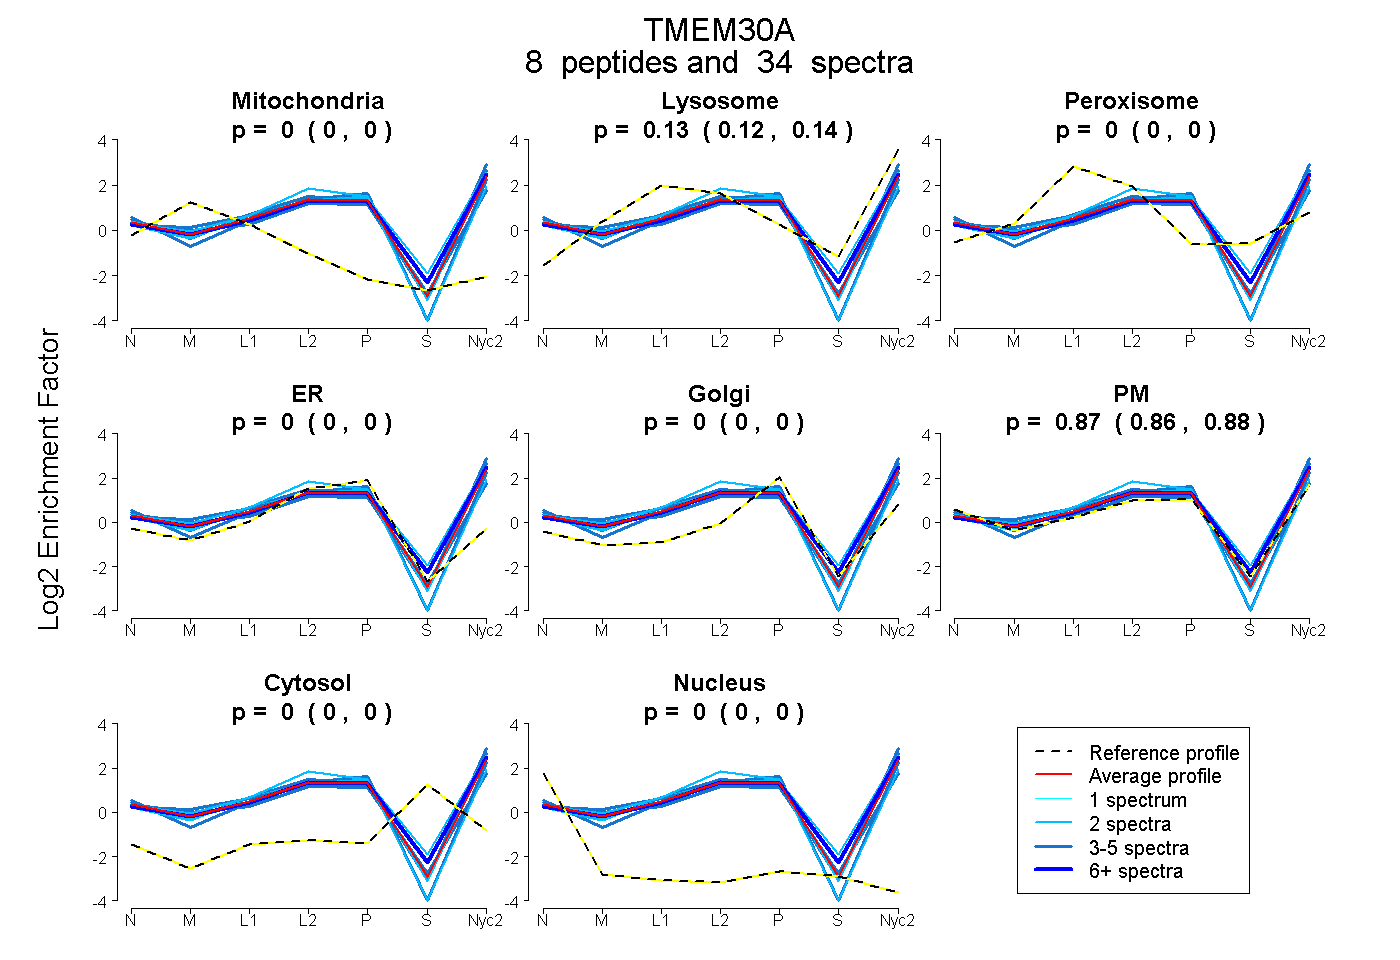
| Expt A |
8 peptides |
34 spectra |
|
0.000 0.000 | 0.000 |
0.132 0.122 | 0.141 |
0.000 0.000 | 0.000 |
0.000 0.000 | 0.000 |
0.000 0.000 | 0.000 |
0.868 0.858 | 0.877 |
0.000 0.000 | 0.000 |
0.000 0.000 | 0.000 |
| 3 spectra, DEVDGGPTGPPGGAAK | 0.000 | 0.000 | 0.000 | 0.006 | 0.000 | 0.994 | 0.000 | 0.000 | ||
| 4 spectra, MILSTISWMGGK | 0.000 | 0.204 | 0.000 | 0.000 | 0.000 | 0.796 | 0.000 | 0.000 | ||
| 2 spectra, NSSNTADITI | 0.000 | 0.049 | 0.000 | 0.145 | 0.000 | 0.806 | 0.000 | 0.000 | ||
| 13 spectra, TAALPTFR | 0.000 | 0.203 | 0.000 | 0.000 | 0.000 | 0.797 | 0.000 | 0.000 | ||
| 2 spectra, GIAWWTDK | 0.000 | 0.277 | 0.000 | 0.000 | 0.000 | 0.723 | 0.000 | 0.000 | ||
| 3 spectra, DSLQEK | 0.000 | 0.190 | 0.000 | 0.000 | 0.000 | 0.810 | 0.000 | 0.000 | ||
| 2 spectra, RPDNTAFK | 0.000 | 0.105 | 0.000 | 0.000 | 0.000 | 0.895 | 0.000 | 0.000 | ||
| 5 spectra, ECEPYR | 0.000 | 0.057 | 0.000 | 0.053 | 0.000 | 0.890 | 0.000 | 0.000 |
| Plot | Mito | Lyso or Perox | ER | Golgi | PM | Cytosol | Nucleus | ||||||
| Expt B |
4 peptides |
10 spectra |
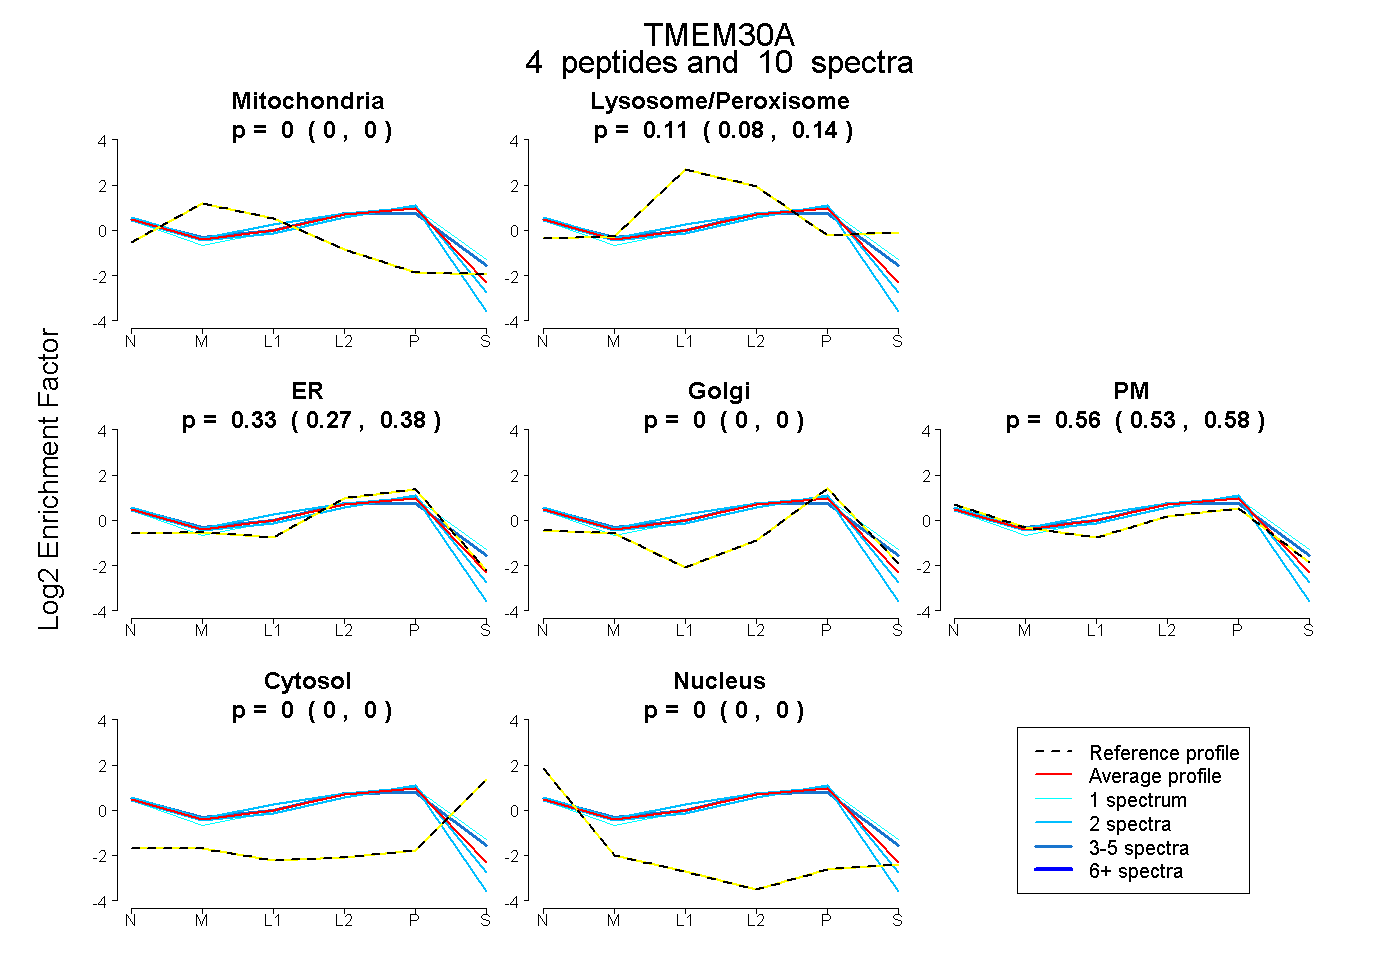 |
0.000 0.000 | 0.000 |
0.114 0.081 | 0.142 |
0.329 0.272 | 0.377 |
0.000 0.000 | 0.000 |
0.556 0.530 | 0.578 |
0.000 0.000 | 0.000 |
0.000 0.000 | 0.000 |
|||
| Plot | Lyso | Other | |||||||||||
| Expt C |
8 peptides |
59 spectra |
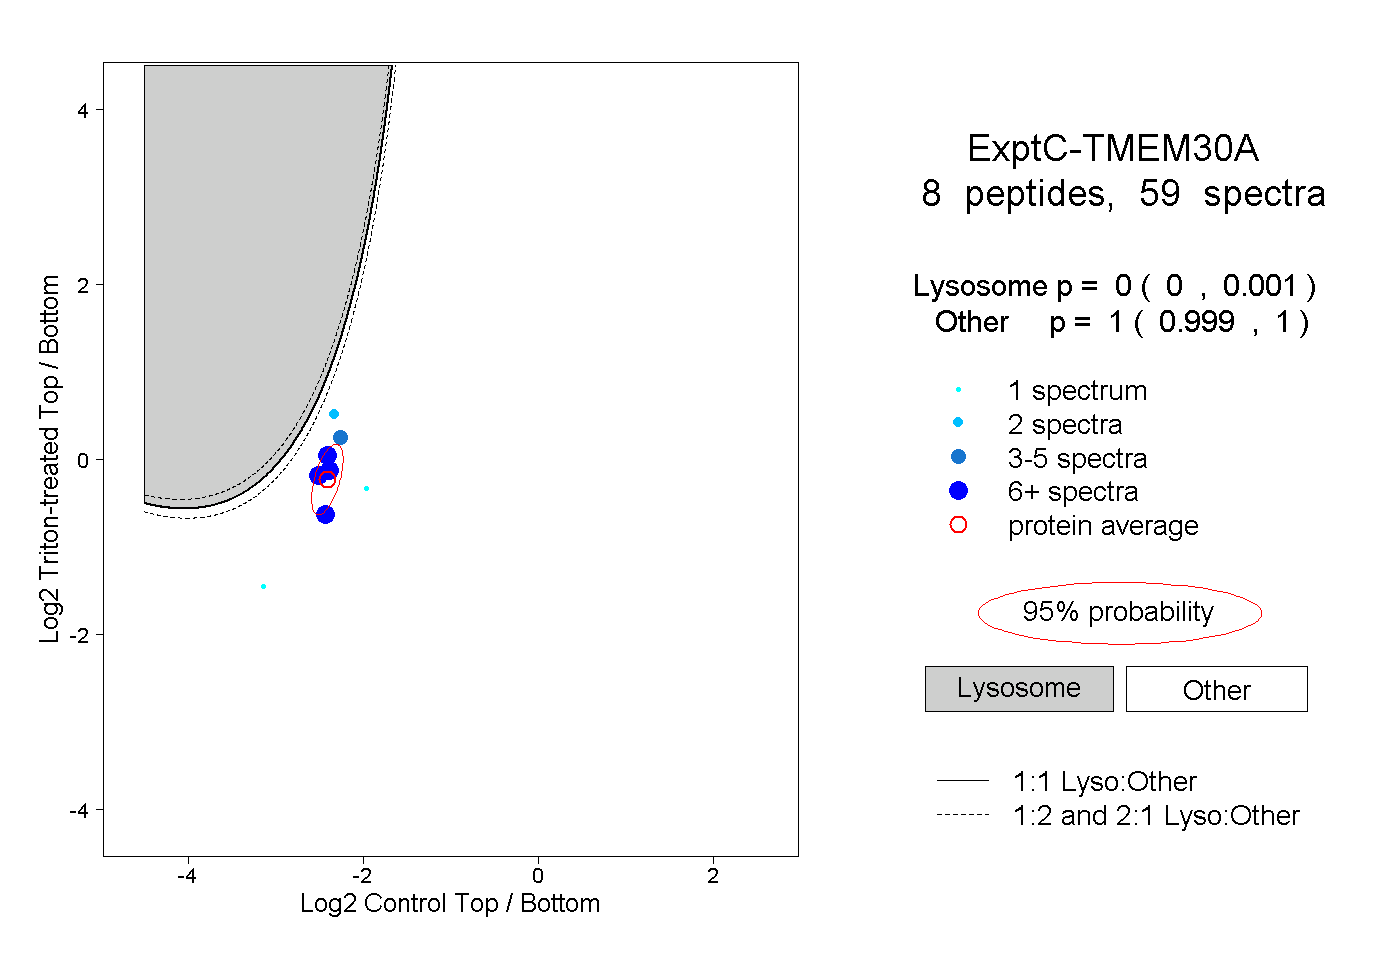 |
0.000 0.000 | 0.001 |
1.000 0.999 | 1.000 |
||||||||
| Plot | Lyso | Other | |||||||||||
| Expt D |
1 peptide |
4 spectra |
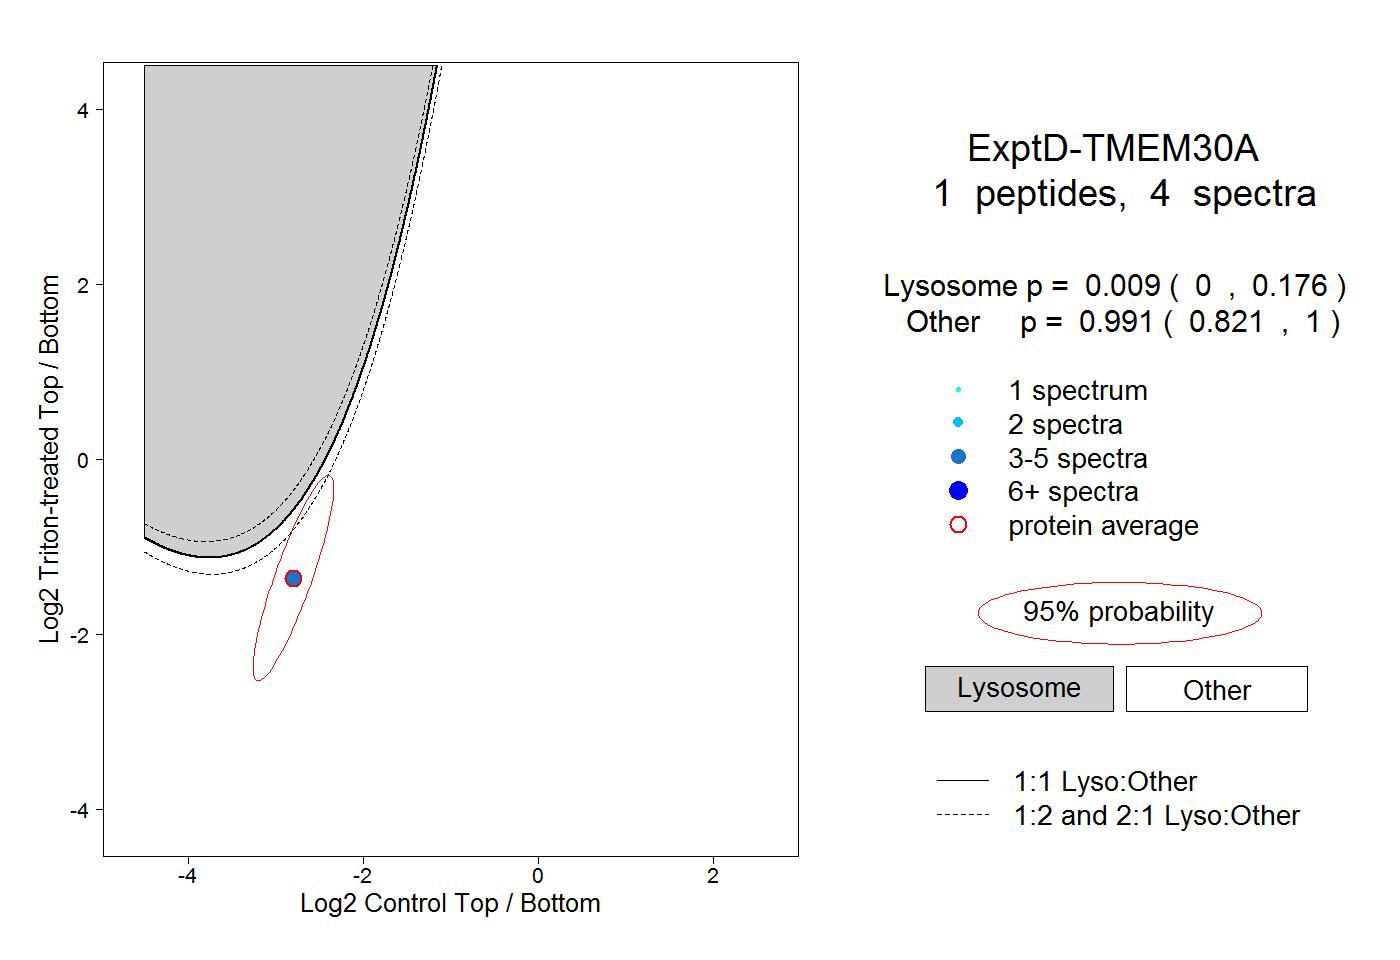 |
0.009 0.000 | 0.176 |
0.991 0.821 | 1.000 |