 2
2peptides
spectra
0.000 | 0.000
0.000 | 0.000
0.000 | 0.043
0.000 | 0.226
0.000 | 0.225
0.000 | 0.211
0.315 | 0.385
0.296 | 0.376
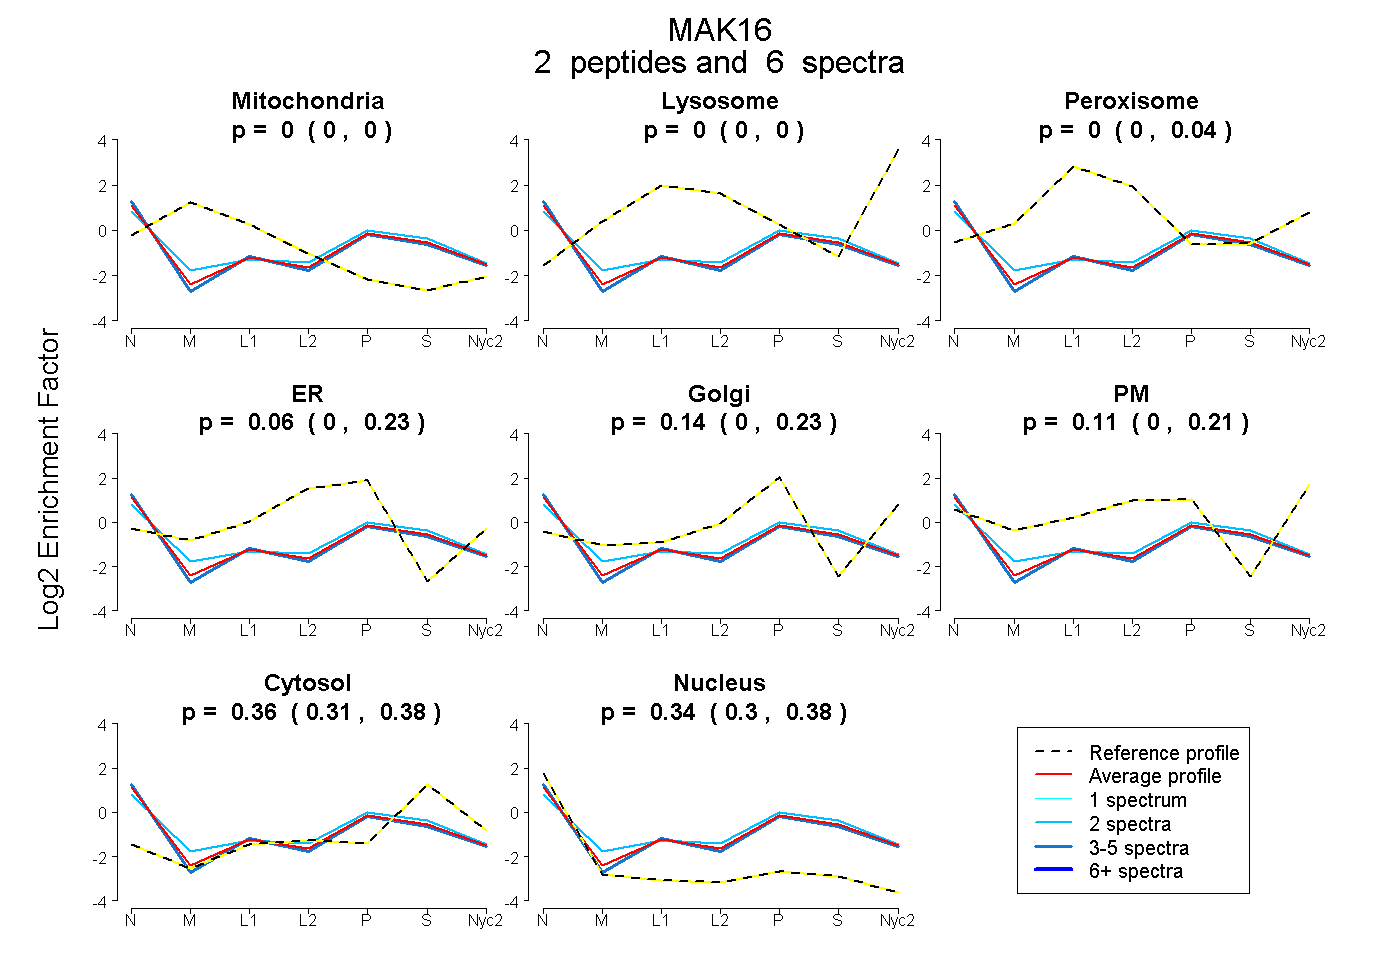
| Plot | Mito | Lyso | Perox | ER | Golgi | PM | Cytosol | Nucleus | |||||
| Expt A |
2 peptides |
6 spectra |
|
0.000 0.000 | 0.000 |
0.000 0.000 | 0.000 |
0.000 0.000 | 0.043 |
0.060 0.000 | 0.226 |
0.135 0.000 | 0.225 |
0.105 0.000 | 0.211 |
0.363 0.315 | 0.385 |
0.337 0.296 | 0.376 |
| 4 spectra, ITQYLIR | 0.000 | 0.000 | 0.000 | 0.030 | 0.138 | 0.116 | 0.348 | 0.368 | ||
| 2 spectra, ALEQIDENLIYWPR | 0.000 | 0.000 | 0.010 | 0.110 | 0.149 | 0.069 | 0.387 | 0.275 |