| 1 spectrum, YNQLFINNEWHDAVSK |
0.733 |
|
0.000 |
|
0.000 |
0.000 |
0.000 |
0.145 |
0.122 |
|
| 1 spectrum, LAPALATGNTVVMK |
0.633 |
|
0.000 |
|
0.000 |
0.311 |
0.000 |
0.057 |
0.000 |
|
| 1 spectrum, LEEVLER |
0.720 |
|
0.000 |
|
0.000 |
0.000 |
0.000 |
0.000 |
0.280 |
|
| 8 spectra, ILGYIR |
0.747 |
|
0.000 |
|
0.000 |
0.000 |
0.000 |
0.000 |
0.253 |
|
| 3 spectra, IEEVIQR |
0.728 |
|
0.000 |
|
0.000 |
0.000 |
0.000 |
0.006 |
0.266 |
|
| 1 spectrum, TFPTVNPTTGEVIGHVAEGDR |
0.749 |
|
0.000 |
|
0.000 |
0.000 |
0.000 |
0.126 |
0.125 |
|
| 1 spectrum, LLQDCR |
0.737 |
|
0.000 |
|
0.000 |
0.000 |
0.000 |
0.000 |
0.263 |
|
| 4 spectra, TFVEESIYHEFLER |
0.751 |
|
0.000 |
|
0.000 |
0.000 |
0.000 |
0.000 |
0.249 |
|
| 2 spectra, LADLVER |
0.673 |
|
0.000 |
|
0.000 |
0.000 |
0.000 |
0.000 |
0.327 |
|
| 2 spectra, ADVDLAVR |
0.653 |
|
0.000 |
|
0.000 |
0.000 |
0.000 |
0.148 |
0.199 |
|
| 2 spectra, EEIFGPVQPLFK |
0.784 |
|
0.000 |
|
0.000 |
0.000 |
0.000 |
0.042 |
0.174 |
|
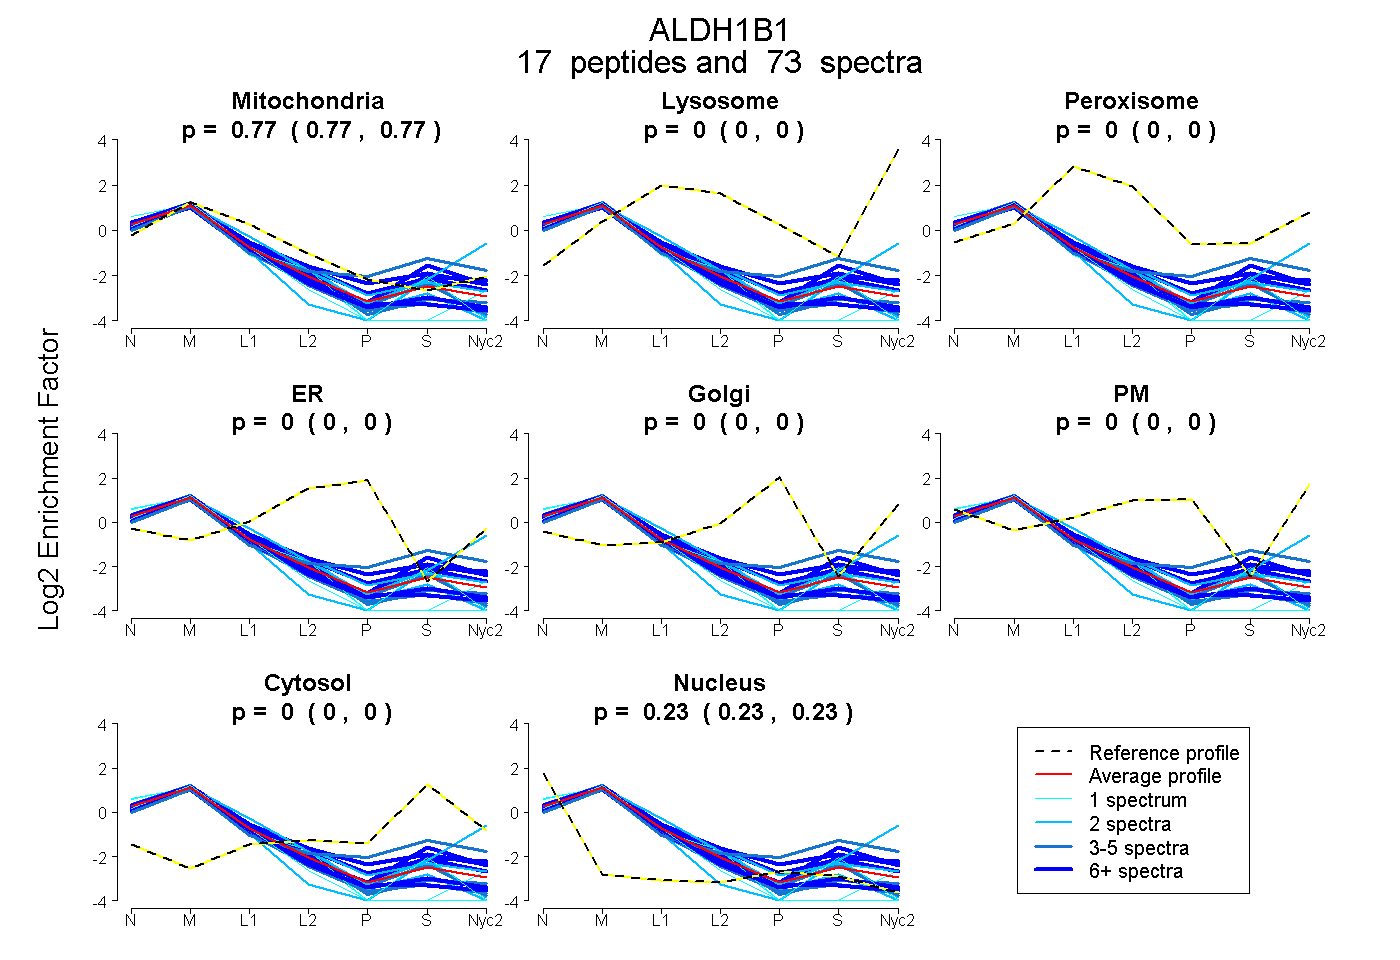
 17
17