 36
36peptides
spectra
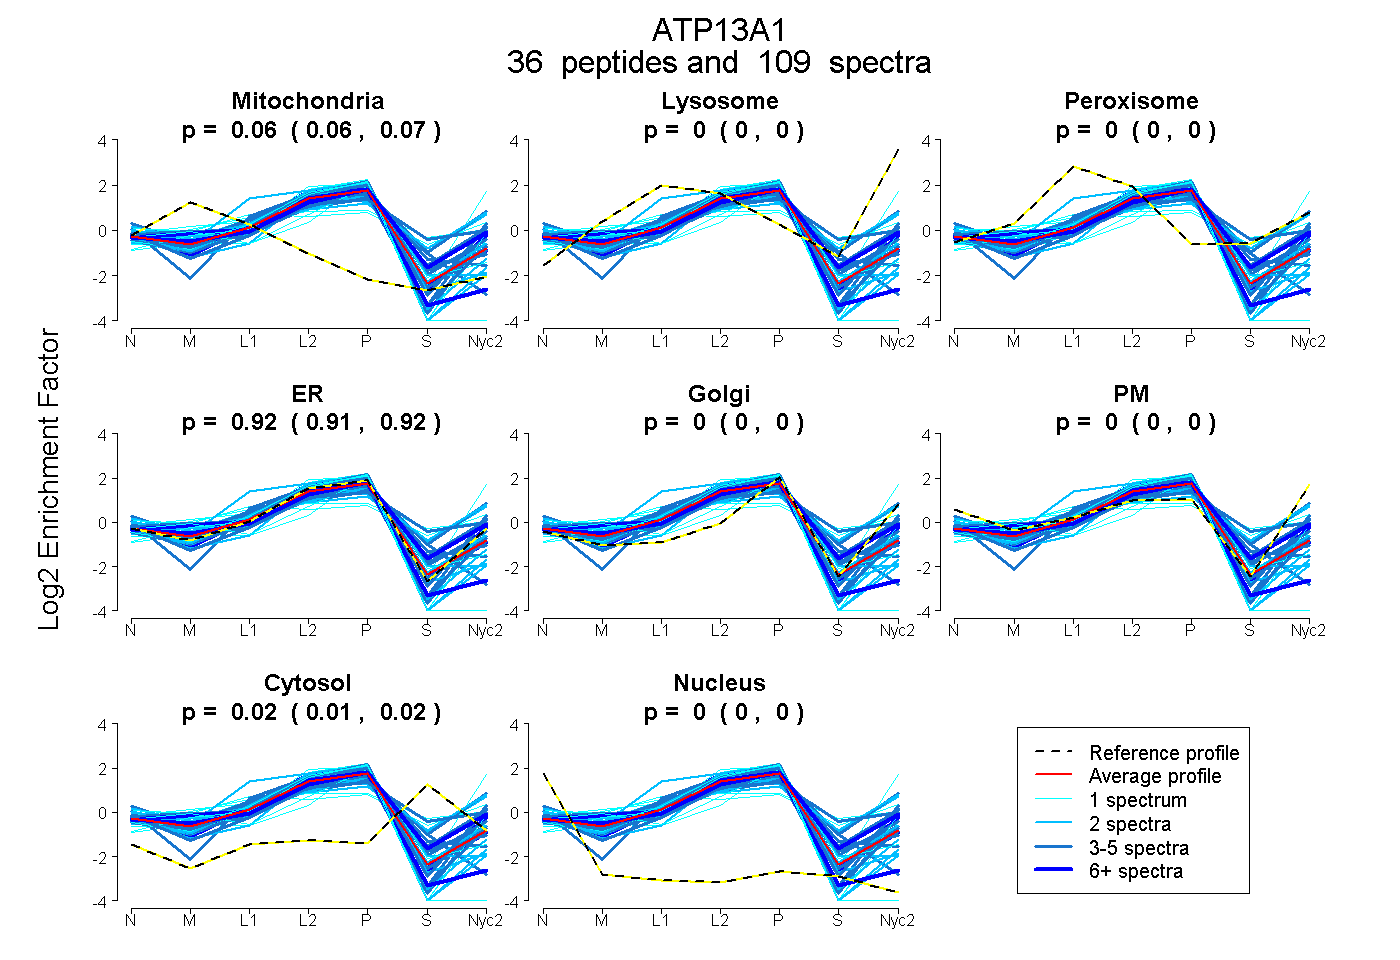
0.059 | 0.068
0.000 | 0.000
0.000 | 0.001
0.914 | 0.919
0.000 | 0.000
0.000 | 0.000
0.015 | 0.023
0.000 | 0.000
14peptides
spectra
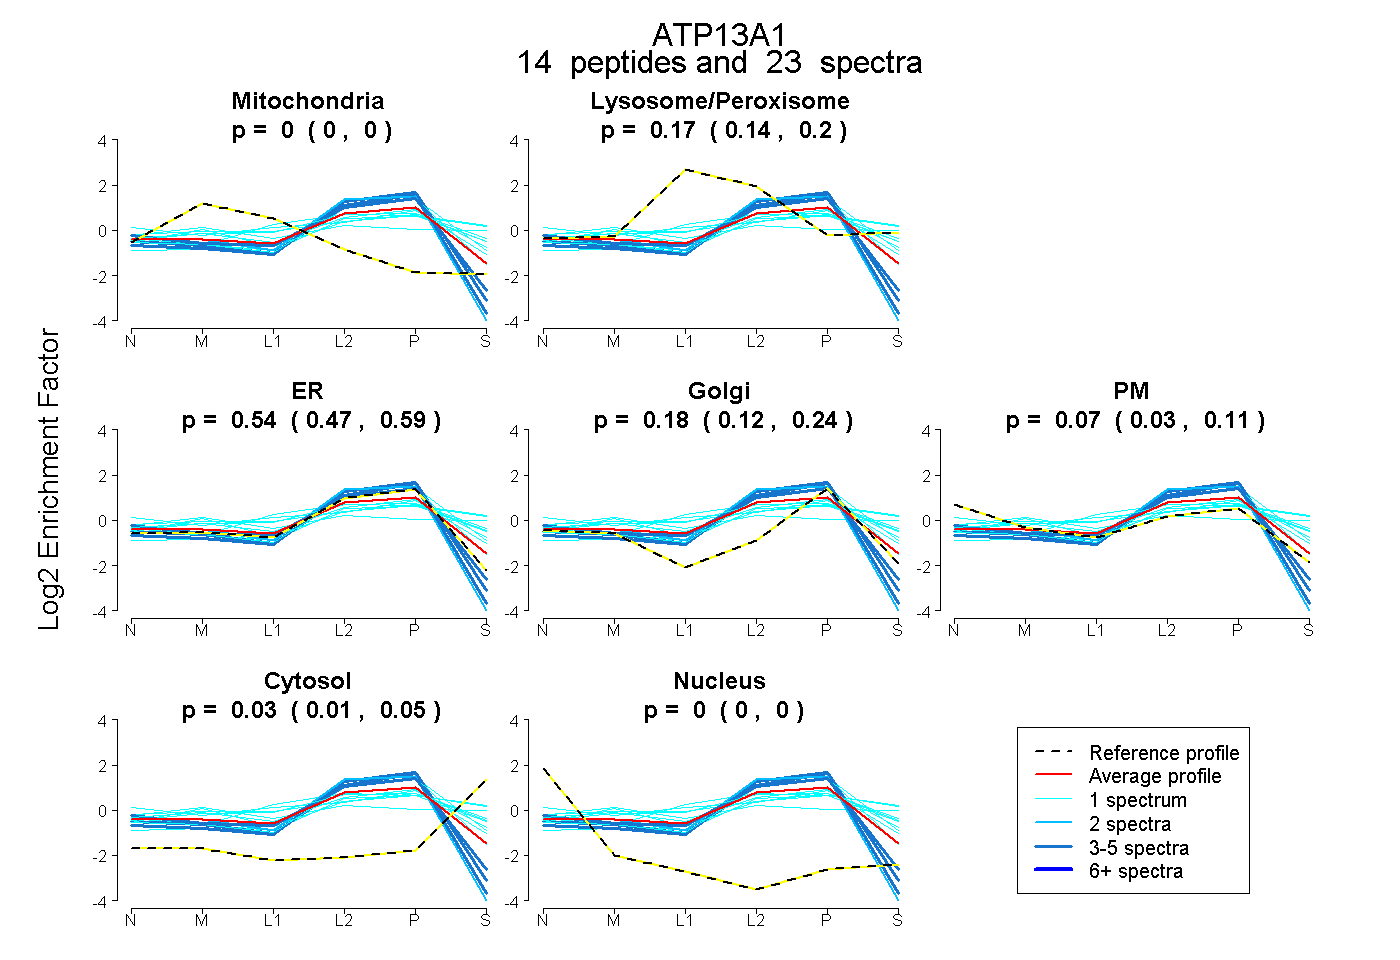
0.000 | 0.000
0.136 | 0.205
0.473 | 0.595
0.116 | 0.239
0.030 | 0.110
0.014 | 0.047
0.000 | 0.000
29peptides
spectra
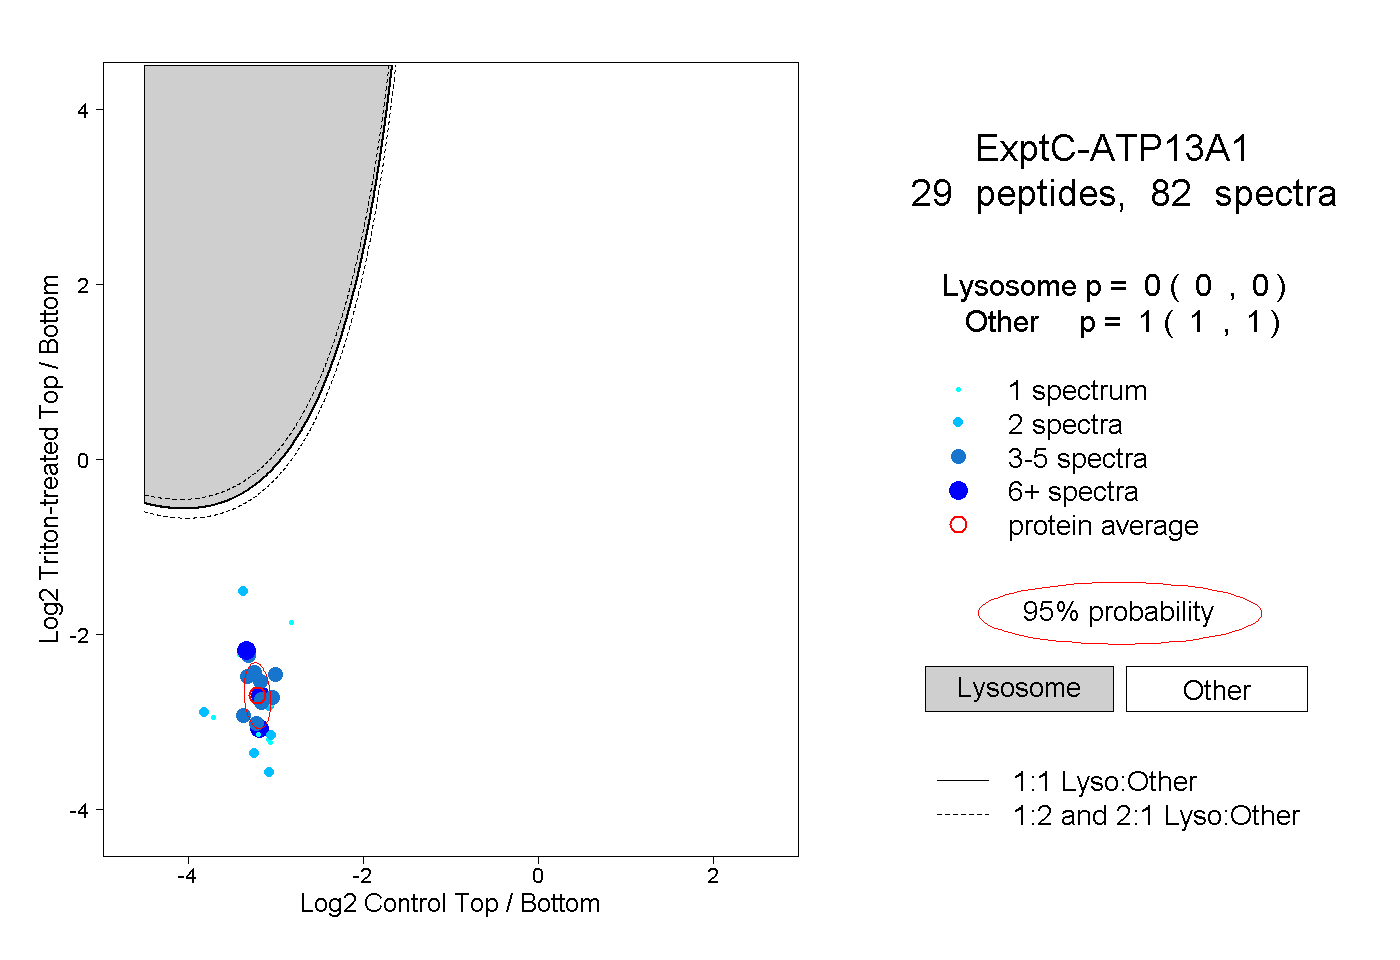
0.000 | 0.000
1.000 | 1.000
4peptides
spectra
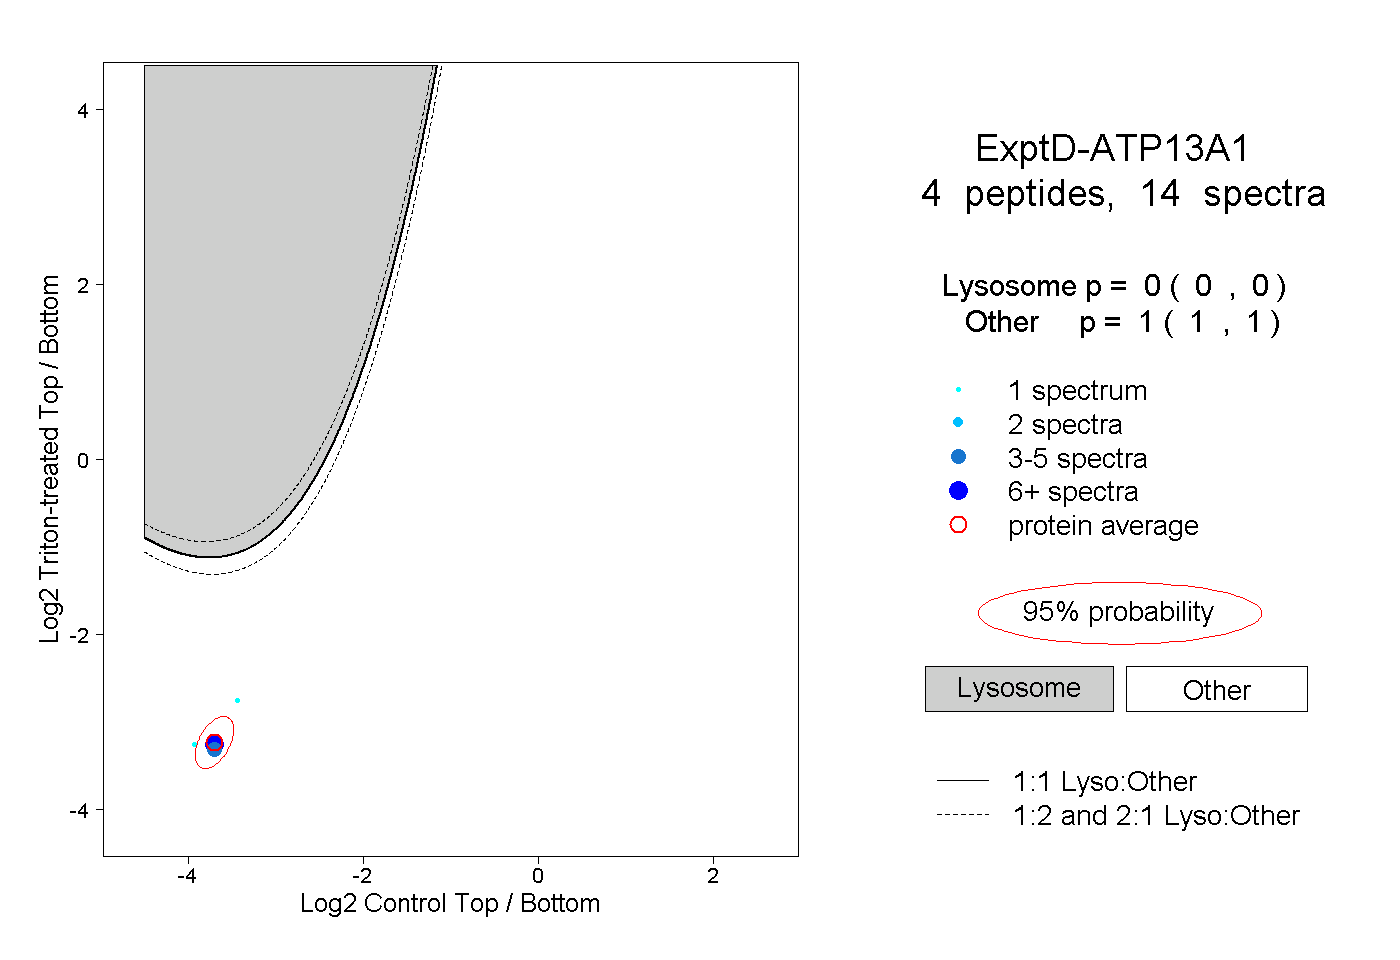
0.000 | 0.000
1.000 | 1.000