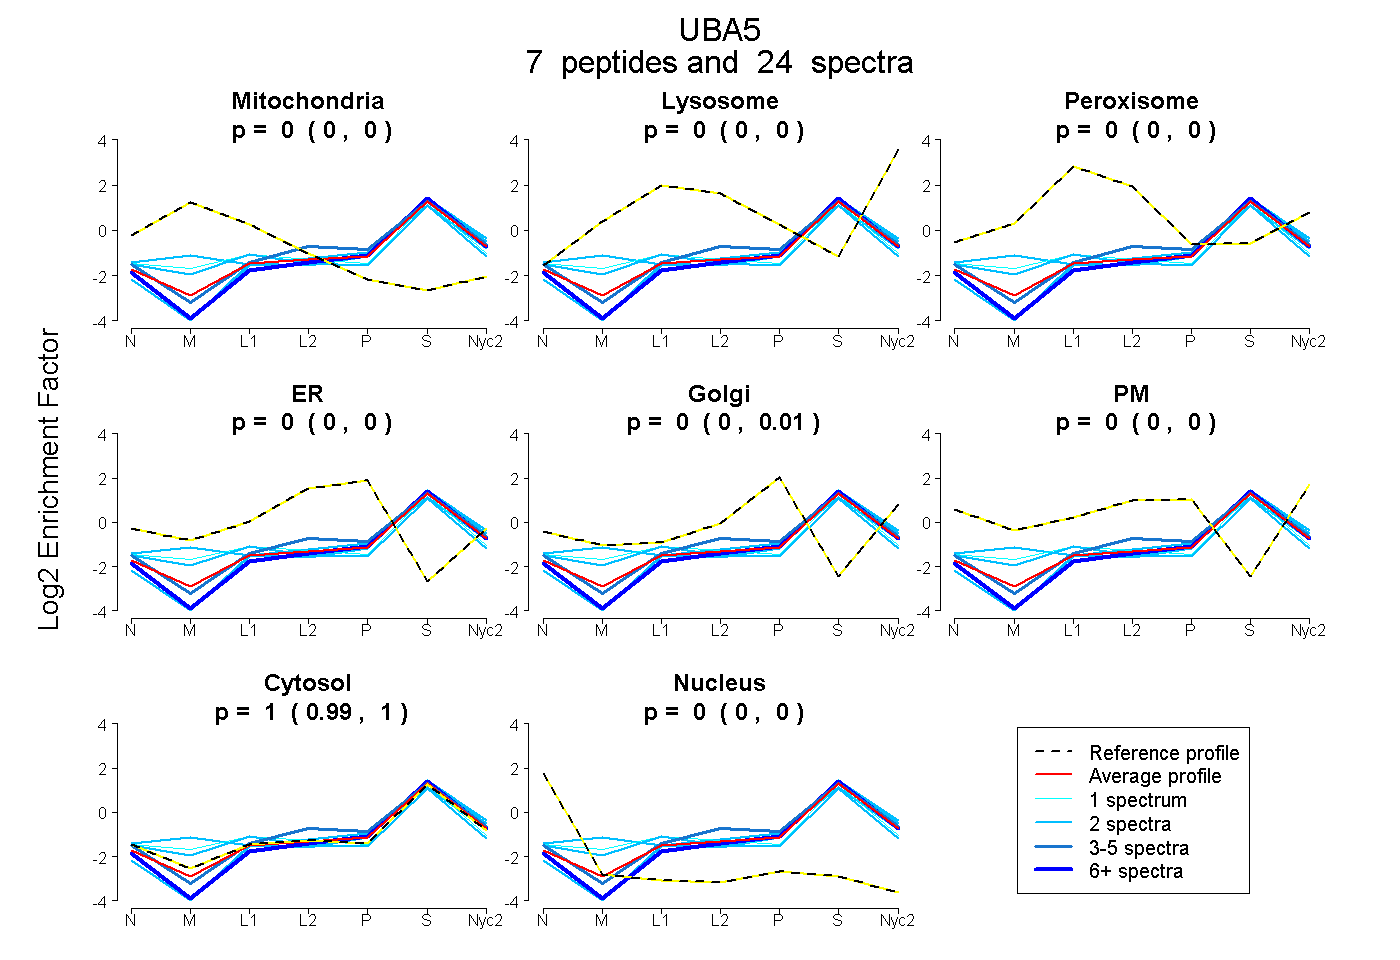
 7
7peptides
spectra
0.000 | 0.000
0.000 | 0.000
0.000 | 0.000
0.000 | 0.000
0.000 | 0.009
0.000 | 0.000
0.989 | 1.000
0.000 | 0.000
| Plot | Mito | Lyso | Perox | ER | Golgi | PM | Cytosol | Nucleus | |||||
| Expt A |
7 peptides |
24 spectra |
|
0.000 0.000 | 0.000 |
0.000 0.000 | 0.000 |
0.000 0.000 | 0.000 |
0.000 0.000 | 0.000 |
0.001 0.000 | 0.009 |
0.000 0.000 | 0.000 |
0.999 0.989 | 1.000 |
0.000 0.000 | 0.000 |
| 2 spectra, MSDEVVDSNPYSR | 0.110 | 0.000 | 0.000 | 0.000 | 0.000 | 0.000 | 0.890 | 0.000 | ||
| 2 spectra, LFFQPYQAGMSK | 0.000 | 0.000 | 0.000 | 0.000 | 0.000 | 0.000 | 1.000 | 0.000 | ||
| 4 spectra, VQAAEHTLR | 0.000 | 0.000 | 0.000 | 0.051 | 0.000 | 0.000 | 0.949 | 0.000 | ||
| 2 spectra, IAGDGHCGR | 0.116 | 0.036 | 0.000 | 0.000 | 0.030 | 0.000 | 0.818 | 0.000 | ||
| 11 spectra, VEELEQELAR | 0.000 | 0.000 | 0.000 | 0.000 | 0.000 | 0.000 | 1.000 | 0.000 | ||
| 1 spectrum, LLLFDYDK | 0.098 | 0.000 | 0.029 | 0.000 | 0.000 | 0.000 | 0.874 | 0.000 | ||
| 2 spectra, LMALK | 0.000 | 0.000 | 0.000 | 0.000 | 0.000 | 0.000 | 1.000 | 0.000 |
| Plot | Mito | Lyso or Perox | ER | Golgi | PM | Cytosol | Nucleus | ||||||
| Expt B |
2 peptides |
4 spectra |
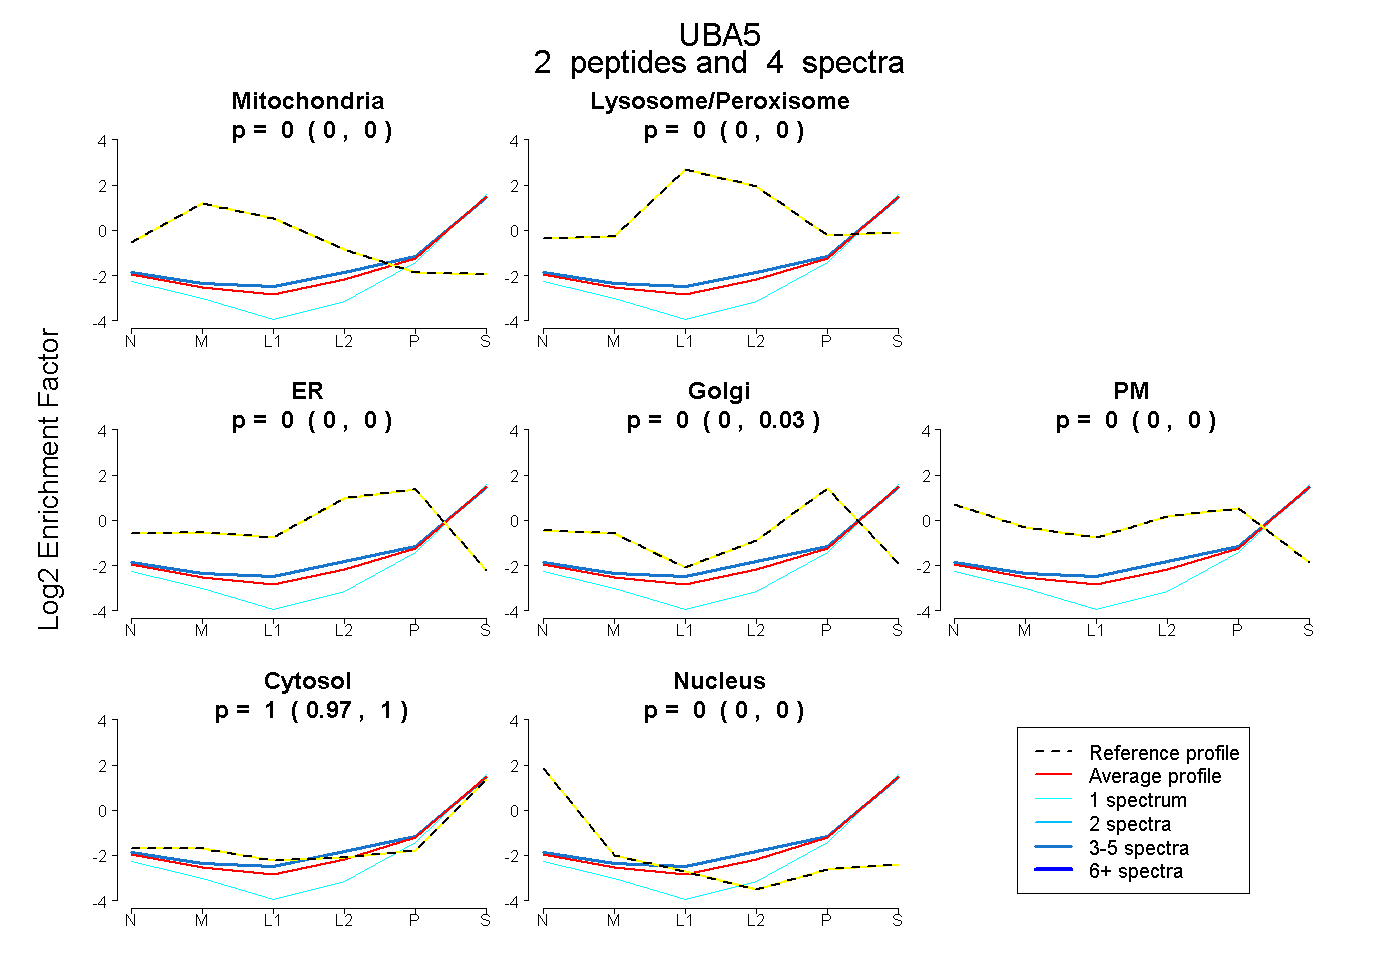 |
0.000 0.000 | 0.000 |
0.000 0.000 | 0.000 |
0.000 0.000 | 0.000 |
0.000 0.000 | 0.027 |
0.000 0.000 | 0.000 |
1.000 0.968 | 1.000 |
0.000 0.000 | 0.000 |
|||
| Plot | Lyso | Other | |||||||||||
| Expt C |
6 peptides |
19 spectra |
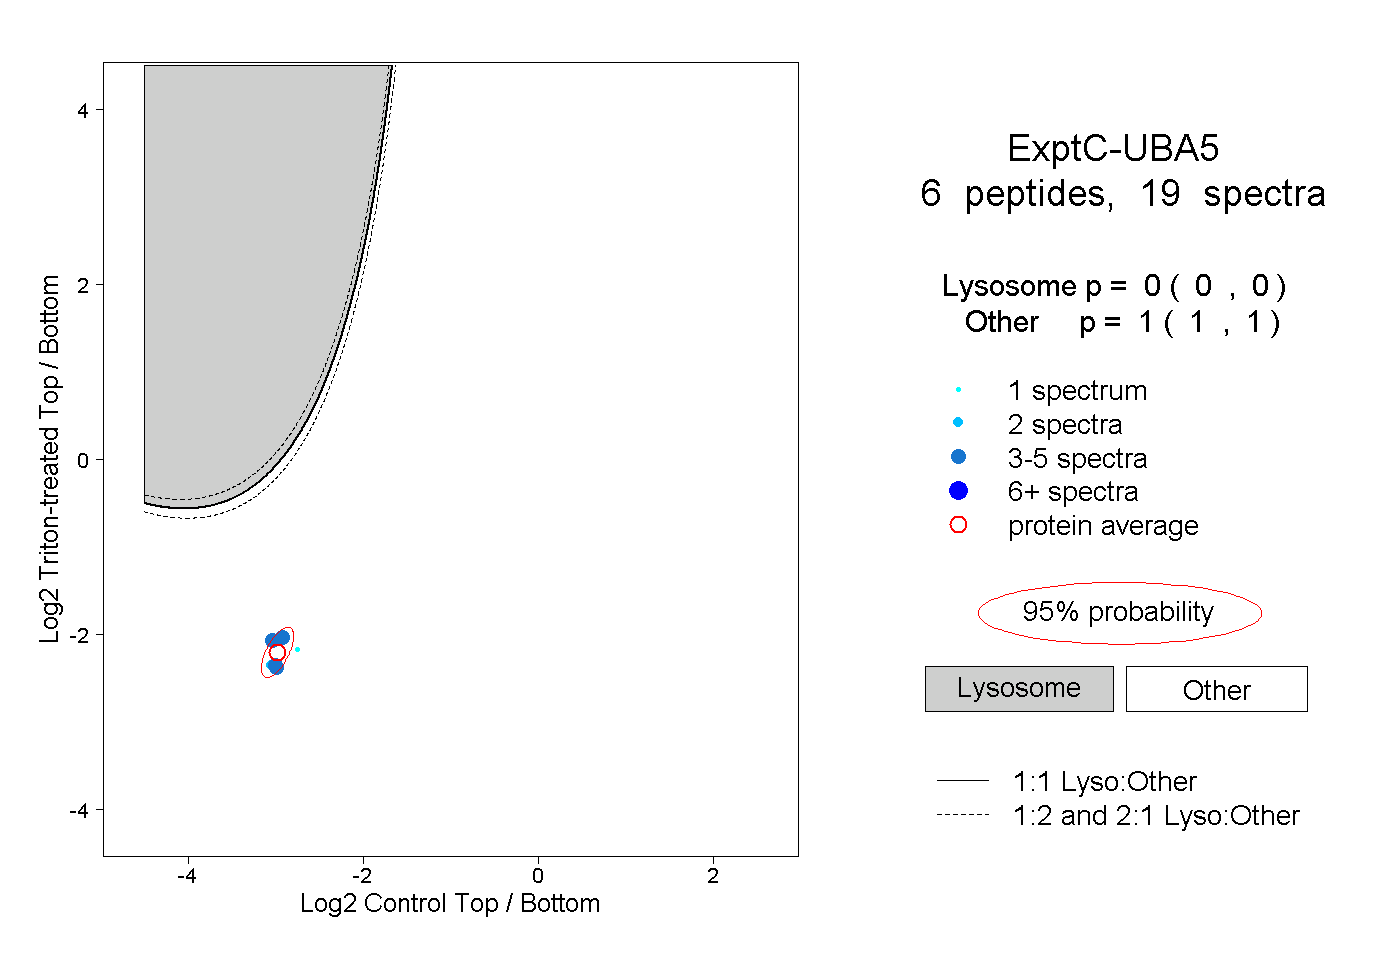 |
0.000 0.000 | 0.000 |
1.000 1.000 | 1.000 |
||||||||
| Plot | Lyso | Other | |||||||||||
| Expt D |
2 peptides |
6 spectra |
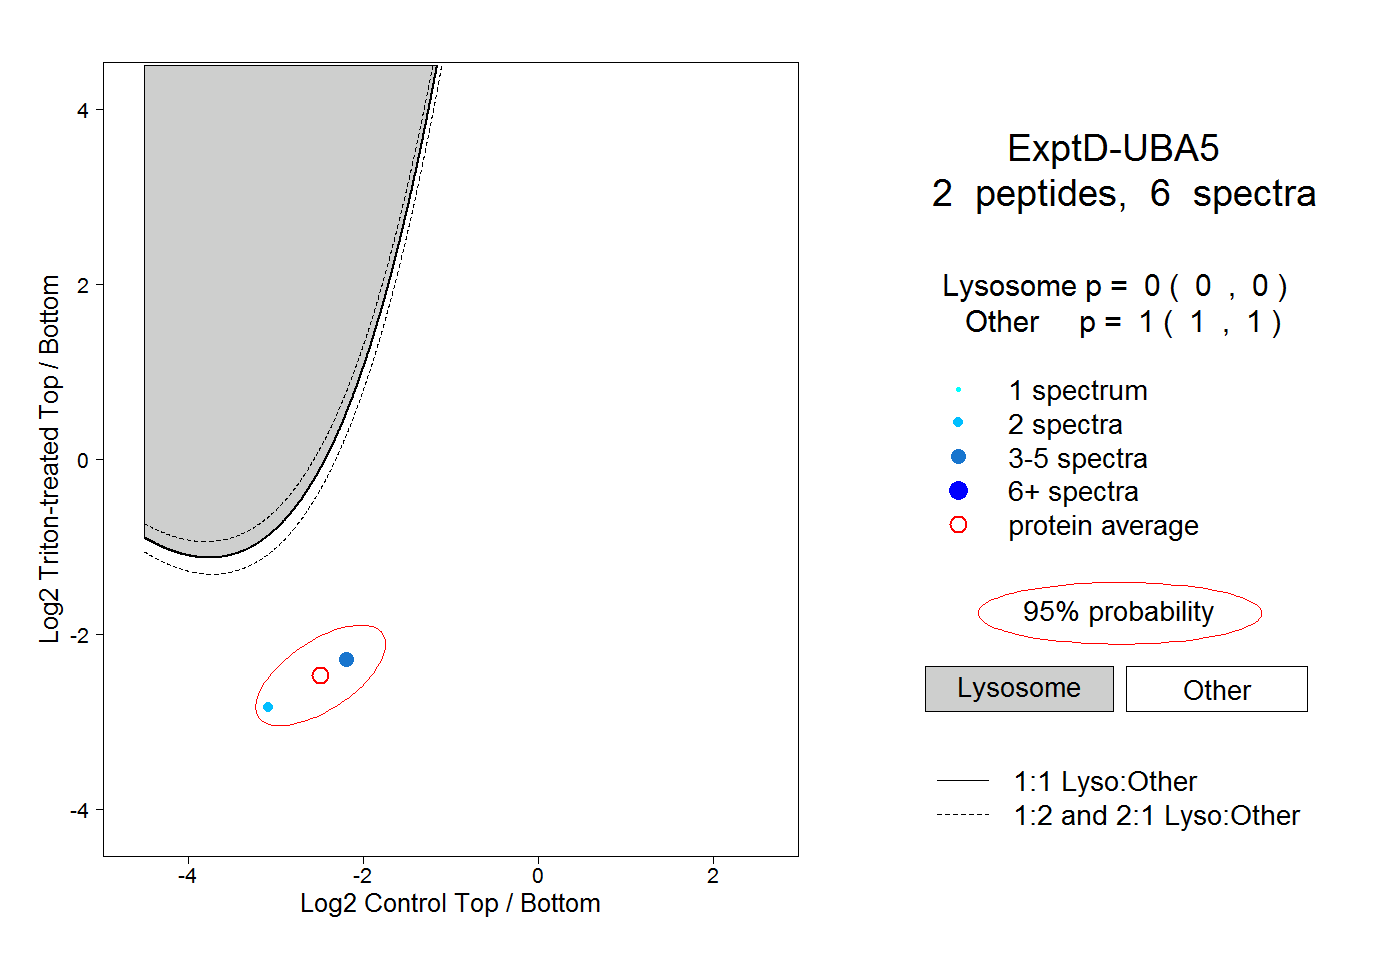 |
0.000 0.000 | 0.000 |
1.000 1.000 | 1.000 |