 3
3peptides
spectra
0.000 | 0.000
0.000 | 0.202
0.000 | 0.153
0.000 | 0.183
0.000 | 0.103
0.000 | 0.198
0.653 | 0.773
0.000 | 0.000
3peptides
spectra
0.000 | 0.000
1.000 | 1.000
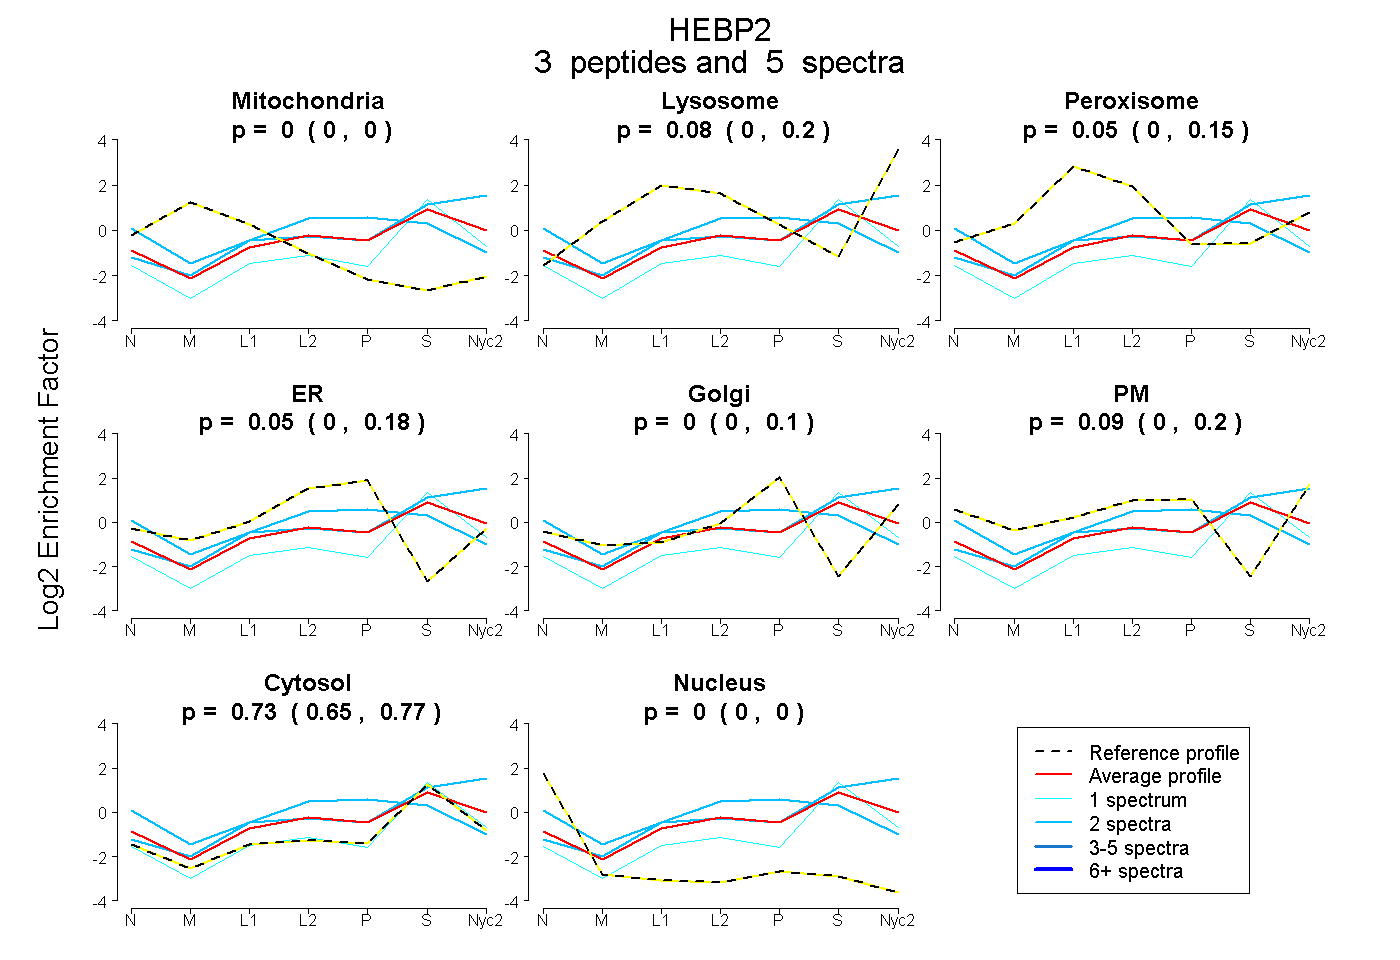
| Plot | Mito | Lyso | Perox | ER | Golgi | PM | Cytosol | Nucleus | |||||
| Expt A |
3 peptides |
5 spectra |
|
0.000 0.000 | 0.000 |
0.077 0.000 | 0.202 |
0.051 0.000 | 0.153 |
0.055 0.000 | 0.183 |
0.000 0.000 | 0.103 |
0.090 0.000 | 0.198 |
0.726 0.653 | 0.773 |
0.000 0.000 | 0.000 |
||
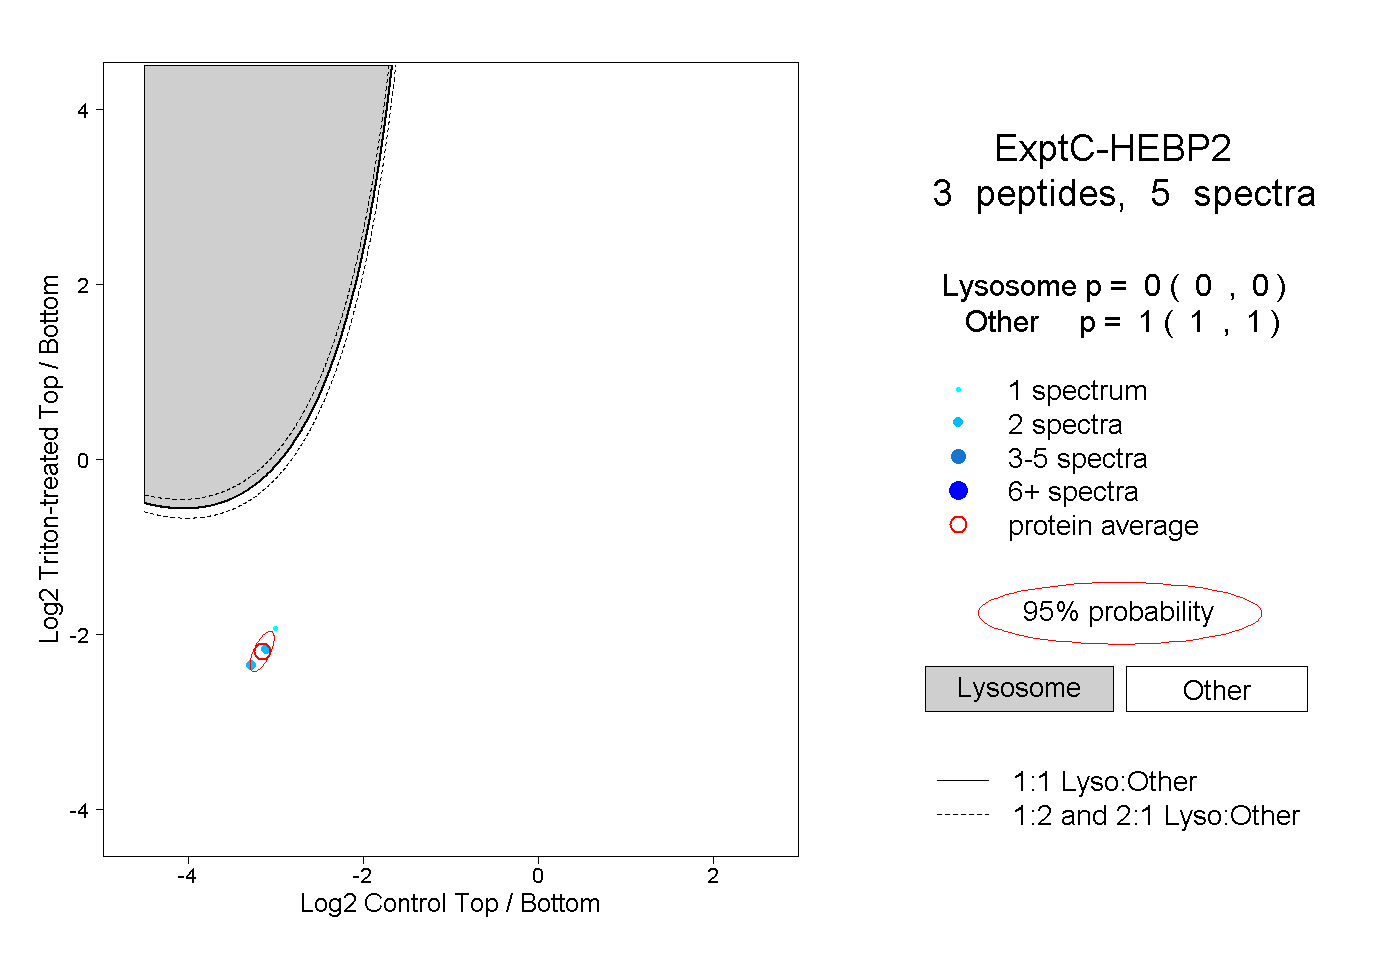
| Plot | Lyso | Other | |||||||||||
| Expt C |
3 peptides |
5 spectra |
|
0.000 0.000 | 0.000 |
1.000 1.000 | 1.000 |