SEC11A
[ENSRNOP00000015218]
Main page
| | | Plot |
Mito |
Lyso |
|
Perox |
ER |
Golgi |
PM |
Cytosol |
Nucleus |
|
| Expt A |
 6
6
peptides |
22
spectra |
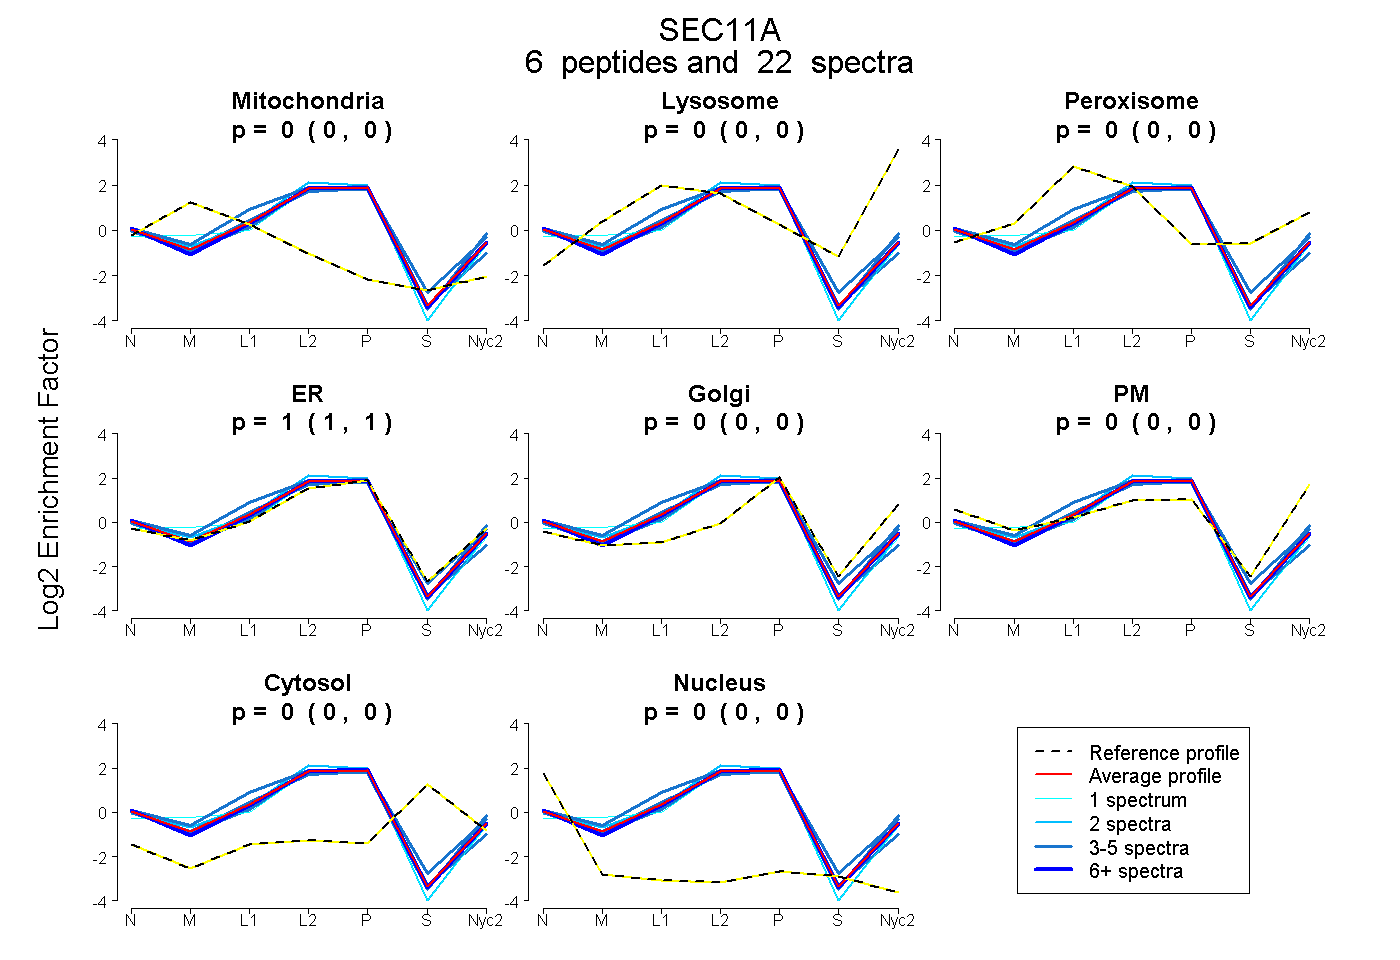 |
0.000
0.000 | 0.000 |
0.000
0.000 | 0.000 |
|
0.000
0.000 | 0.000 |
1.000
1.000 | 1.000 |
0.000
0.000 | 0.000 |
0.000
0.000 | 0.000 |
0.000
0.000 | 0.000 |
0.000
0.000 | 0.000 |
|
| | | Plot |
Mito |
|
Lyso or Perox |
|
ER |
Golgi |
PM |
Cytosol |
Nucleus |
|
| Expt B |
7
peptides |
22
spectra |
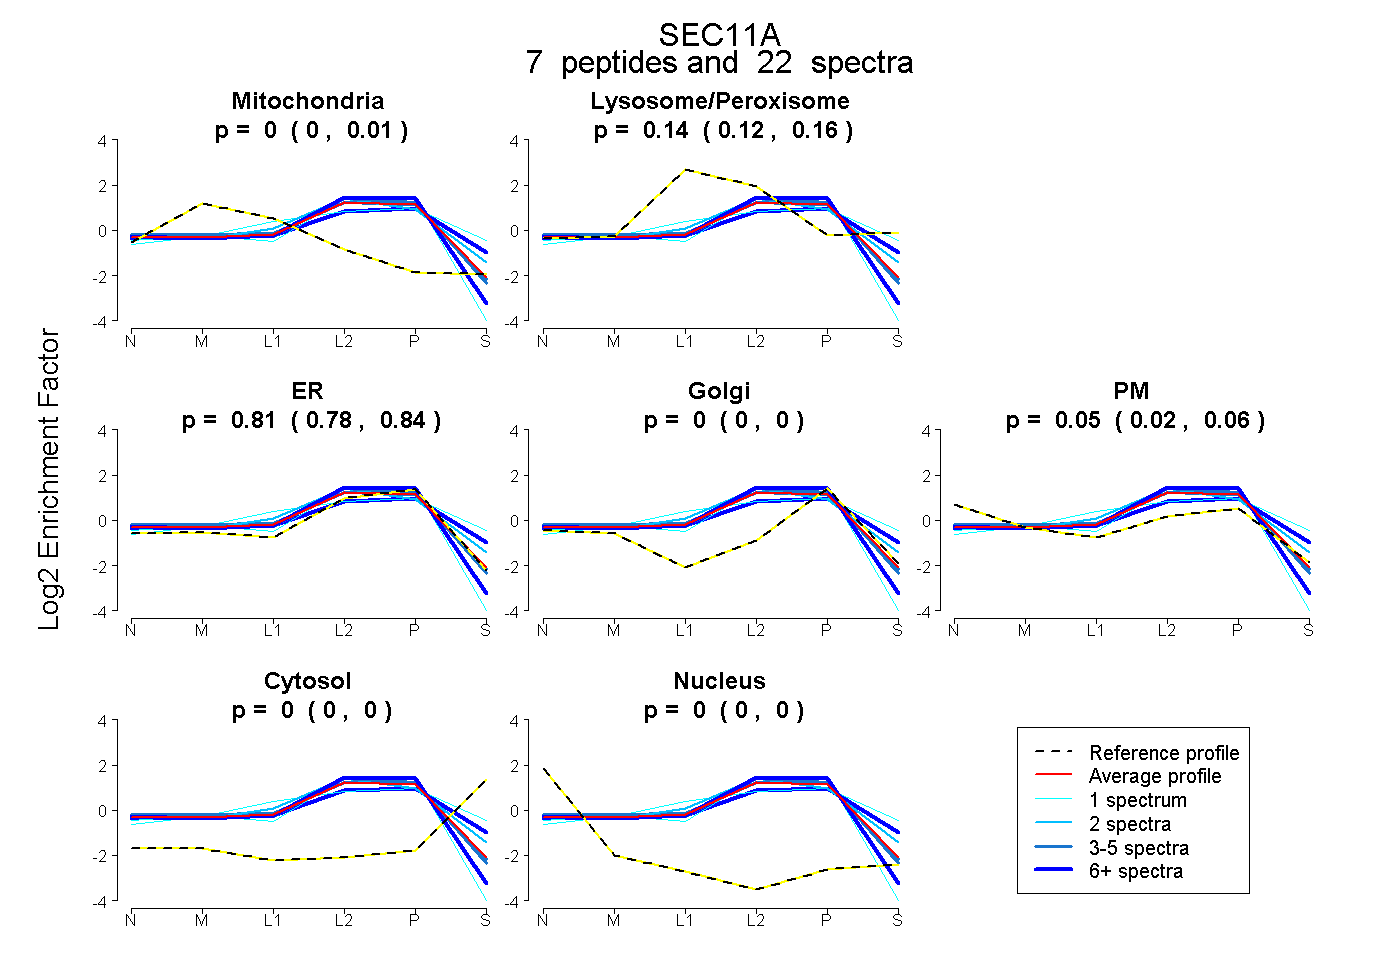 |
0.000
0.000 | 0.005 |
|
0.144
0.124 | 0.160 |
|
0.809
0.776 | 0.836 |
0.000
0.000 | 0.000 |
0.047
0.023 | 0.062 |
0.000
0.000 | 0.000 |
0.000
0.000 | 0.000 |
|
| 1 spectrum, GDNNAVDDR |
0.000 |
|
0.000 |
|
1.000 |
0.000 |
0.000 |
0.000 |
0.000 |
|
| 6 spectra, VGEIVVFR |
0.000 |
|
0.009 |
|
0.991 |
0.000 |
0.000 |
0.000 |
0.000 |
|
| 2 spectra, QGQHWLEK |
0.000 |
|
0.285 |
|
0.638 |
0.000 |
0.077 |
0.000 |
0.000 |
|
| 1 spectrum, MLSLDFLDDVR |
0.000 |
|
0.528 |
|
0.046 |
0.408 |
0.000 |
0.019 |
0.000 |
|
| 3 spectra, VEDPIR |
0.000 |
|
0.113 |
|
0.883 |
0.000 |
0.004 |
0.000 |
0.000 |
|
| 3 spectra, QDGHIK |
0.000 |
|
0.143 |
|
0.758 |
0.000 |
0.099 |
0.000 |
0.000 |
|
| 6 spectra, EIPIVHR |
0.000 |
|
0.330 |
|
0.344 |
0.299 |
0.000 |
0.028 |
0.000 |
|
| | | Plot |
|
Lyso |
|
|
|
|
|
|
|
Other |
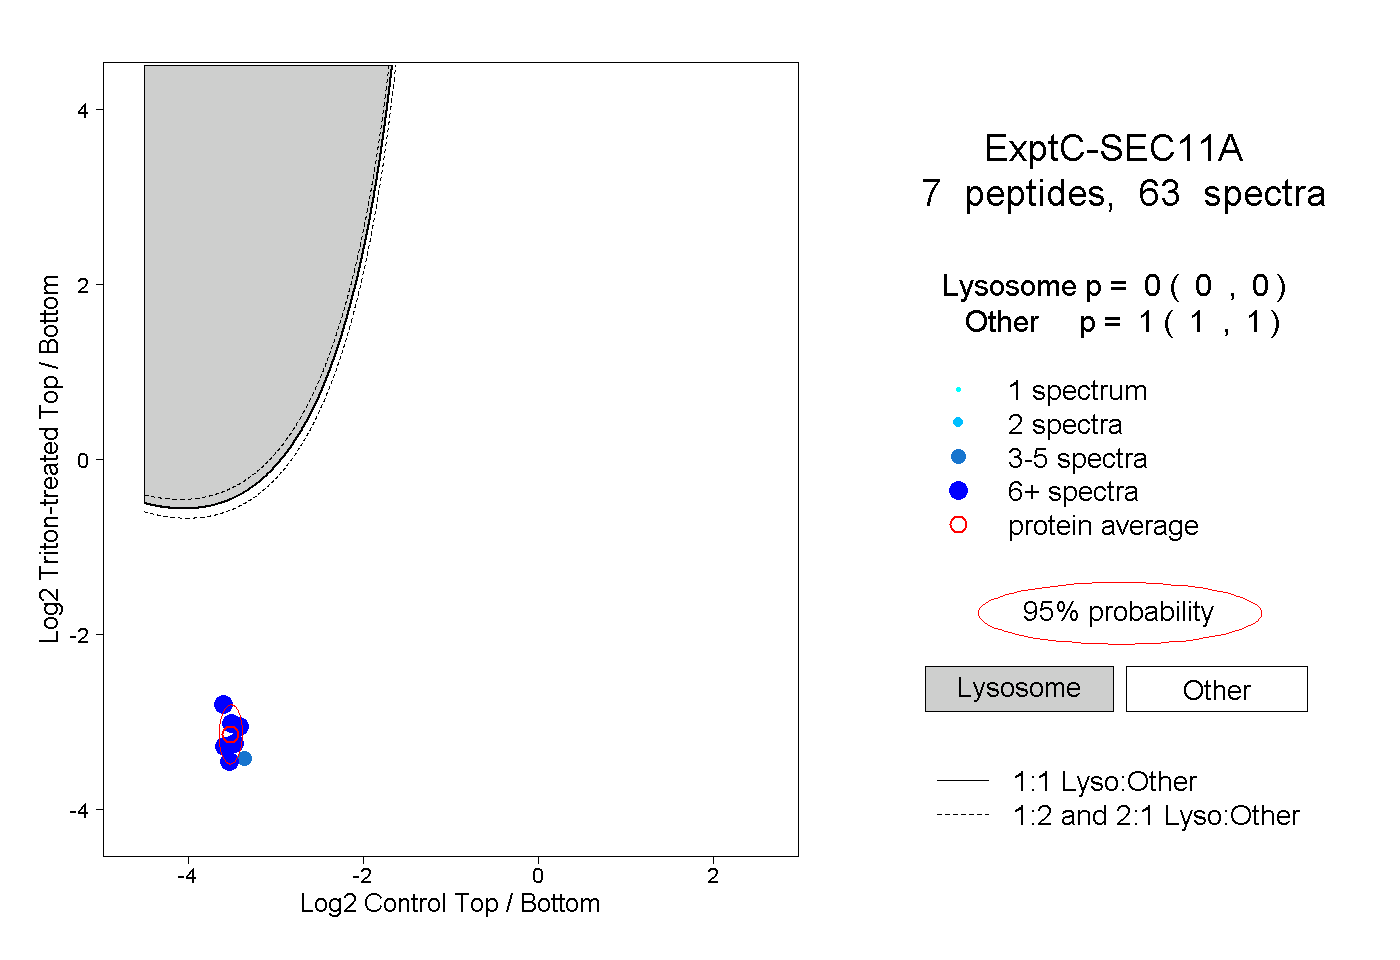
| Expt C |
7
peptides |
63
spectra |
 |
|
0.000
0.000 | 0.000 |
|
|
|
|
|
|
|
1.000
1.000 | 1.000 |
| | | Plot |
|
Lyso |
|
|
|
|
|
|
|
Other |
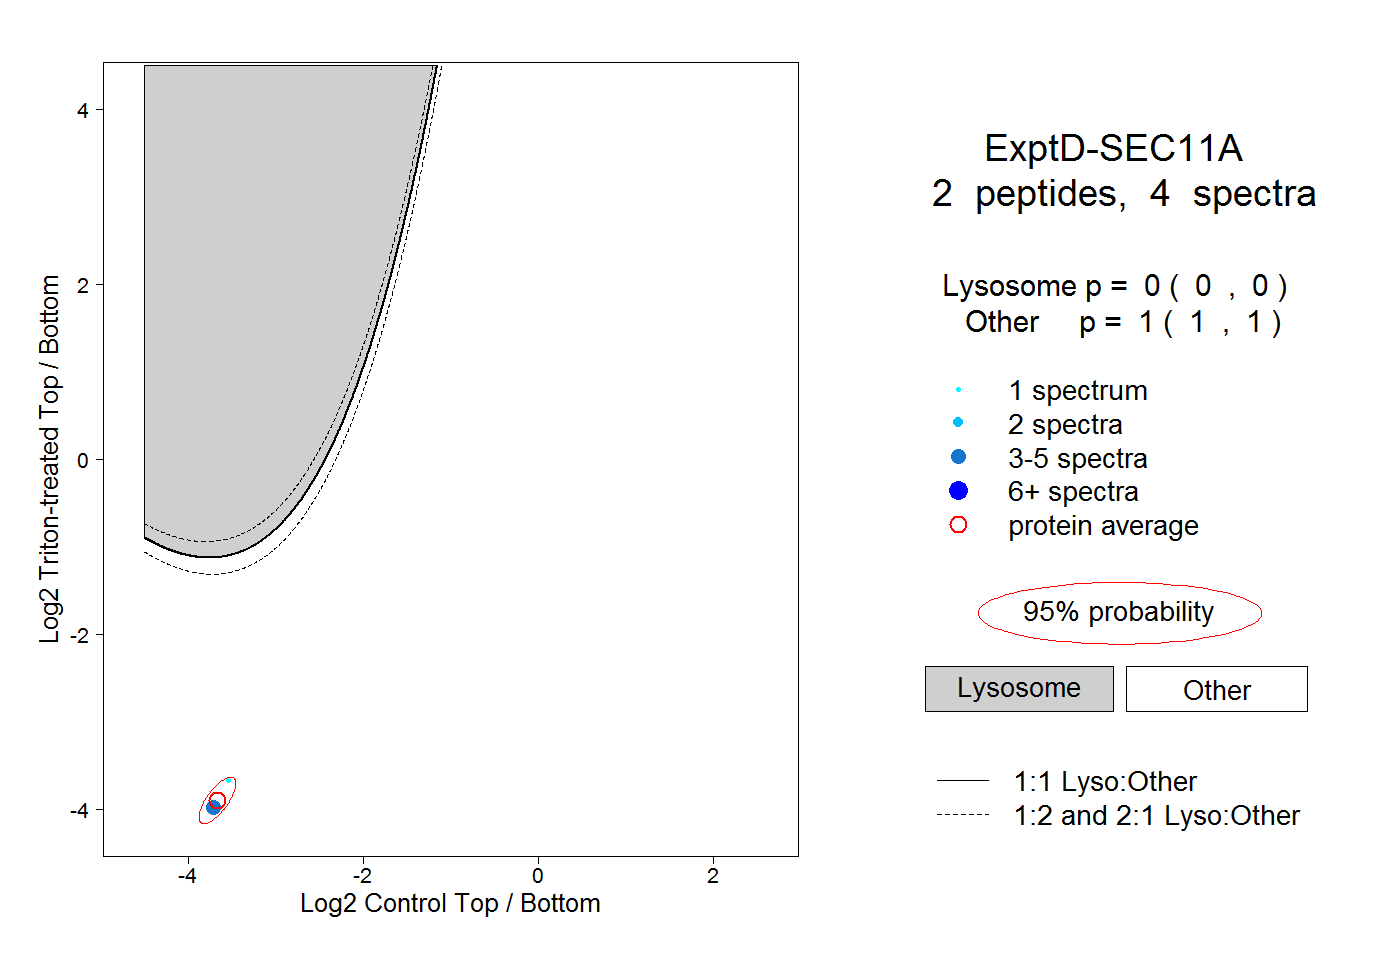
| Expt D |
2
peptides |
4
spectra |
 |
|
0.000
0.000 | 0.000 |
|
|
|
|
|
|
|
1.000
1.000 | 1.000 |