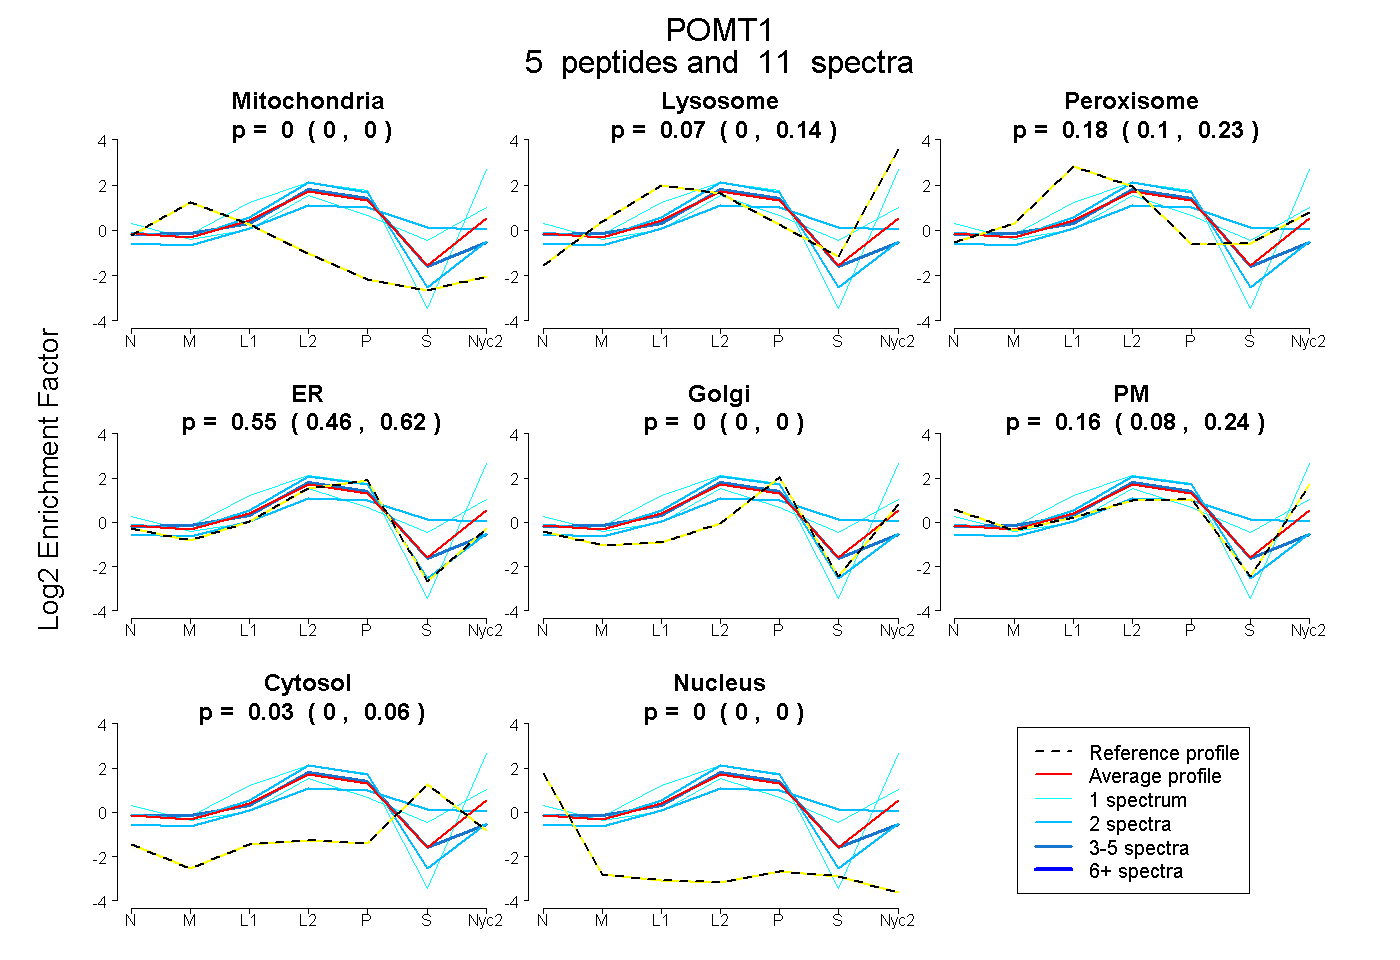
 5
5peptides
spectra
0.000 | 0.000
0.000 | 0.141
0.100 | 0.233
0.462 | 0.624
0.000 | 0.000
0.082 | 0.237
0.000 | 0.062
0.000 | 0.000
| Plot | Mito | Lyso | Perox | ER | Golgi | PM | Cytosol | Nucleus | |||||
| Expt A |
5 peptides |
11 spectra |
|
0.000 0.000 | 0.000 |
0.074 0.000 | 0.141 |
0.176 0.100 | 0.233 |
0.553 0.462 | 0.624 |
0.000 0.000 | 0.000 |
0.163 0.082 | 0.237 |
0.034 0.000 | 0.062 |
0.000 0.000 | 0.000 |