 9
9peptides
spectra
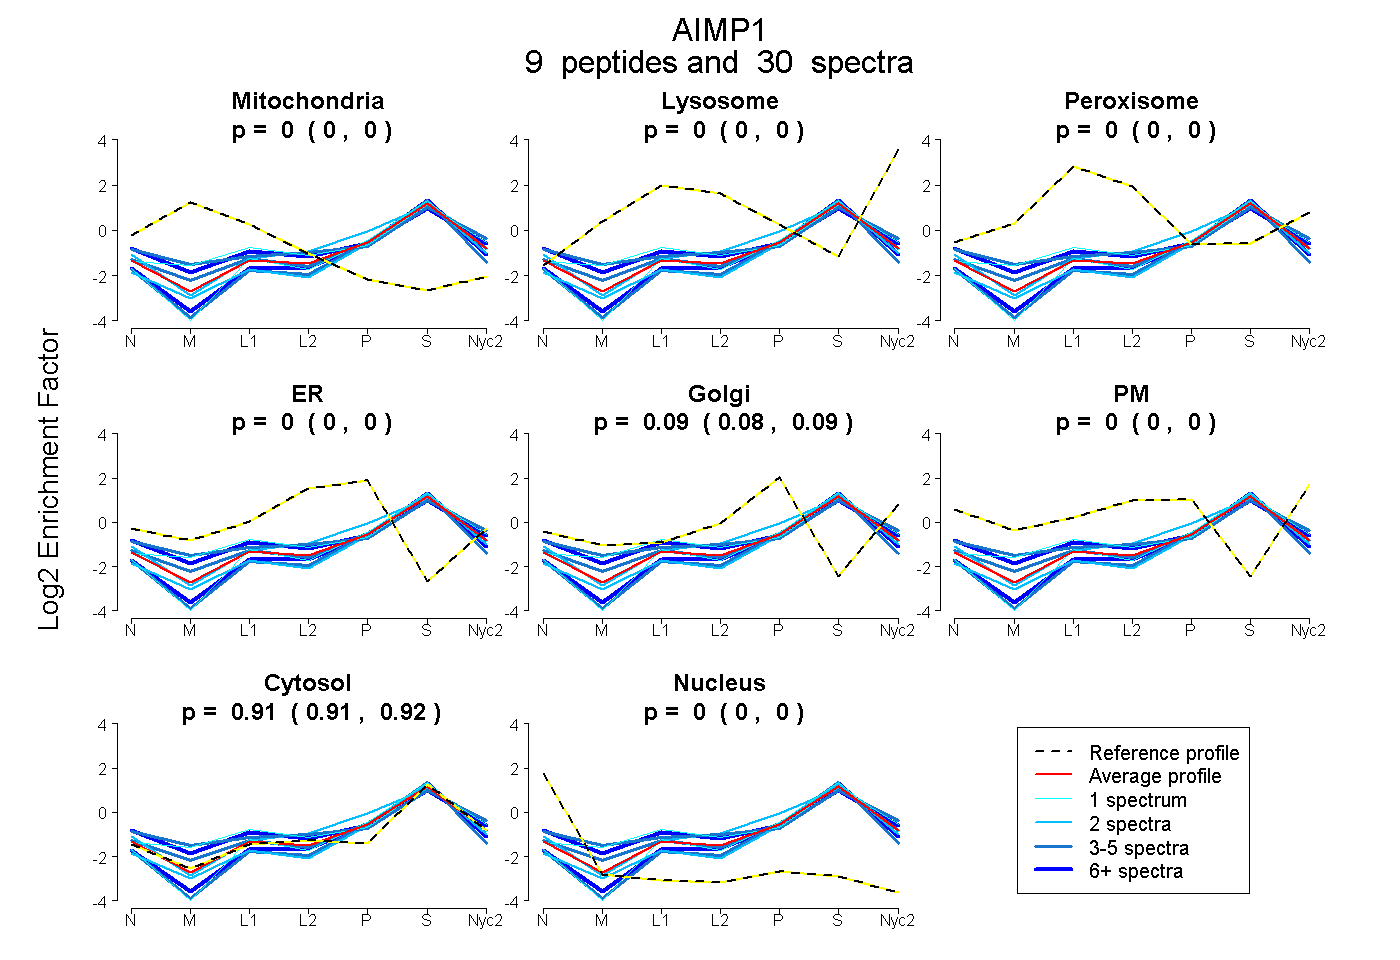
0.000 | 0.000
0.000 | 0.000
0.000 | 0.000
0.000 | 0.000
0.080 | 0.093
0.000 | 0.000
0.906 | 0.919
0.000 | 0.000
1peptide
spectra
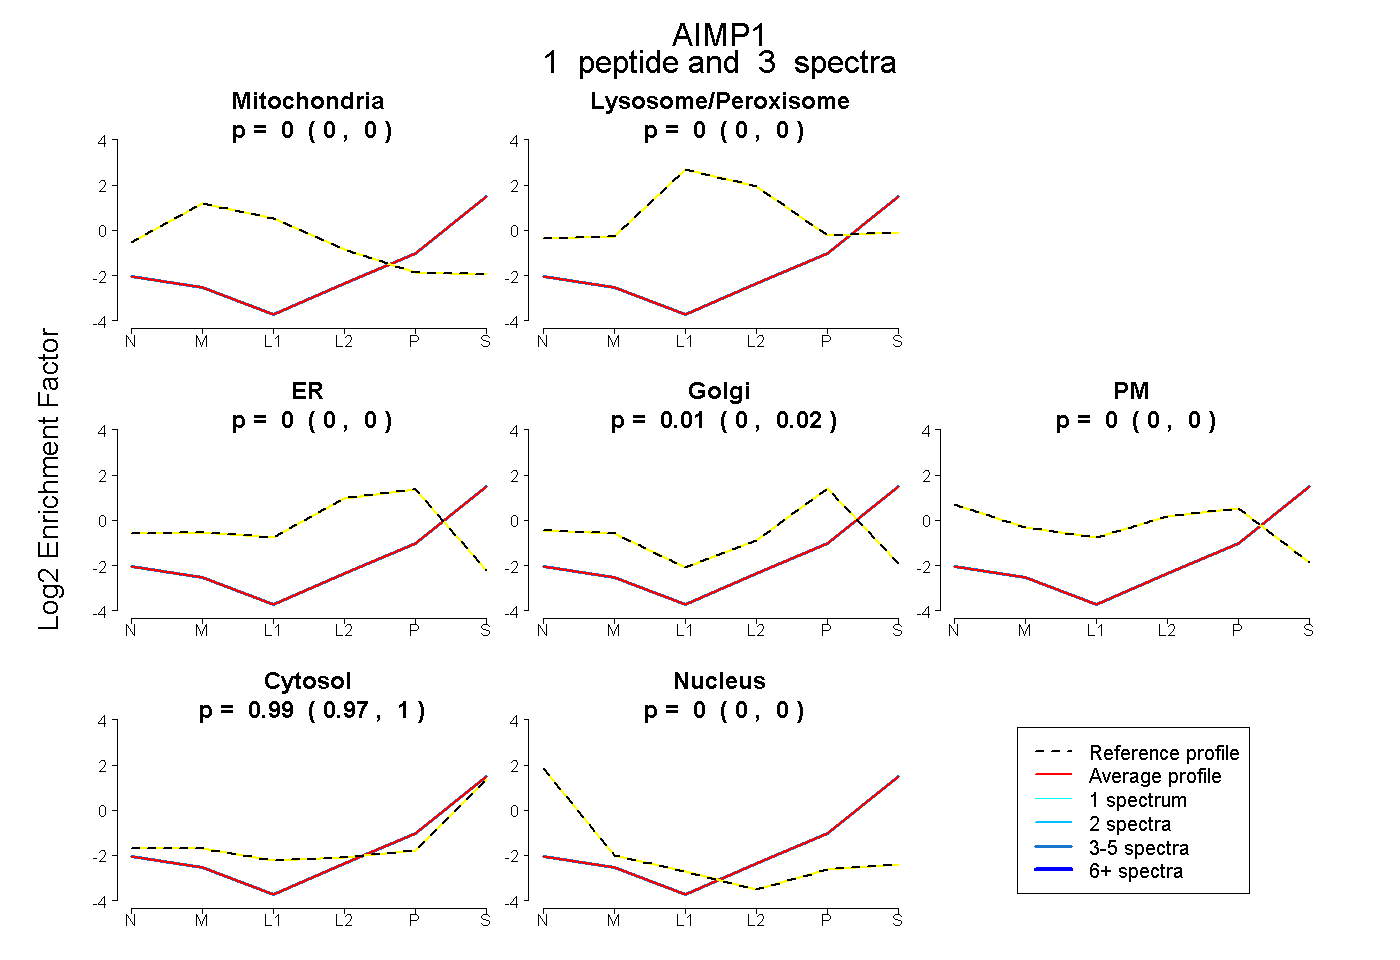
0.000 | 0.000
0.000 | 0.000
0.000 | 0.000
0.000 | 0.022
0.000 | 0.000
0.974 | 1.000
0.000 | 0.000
8peptides
spectra
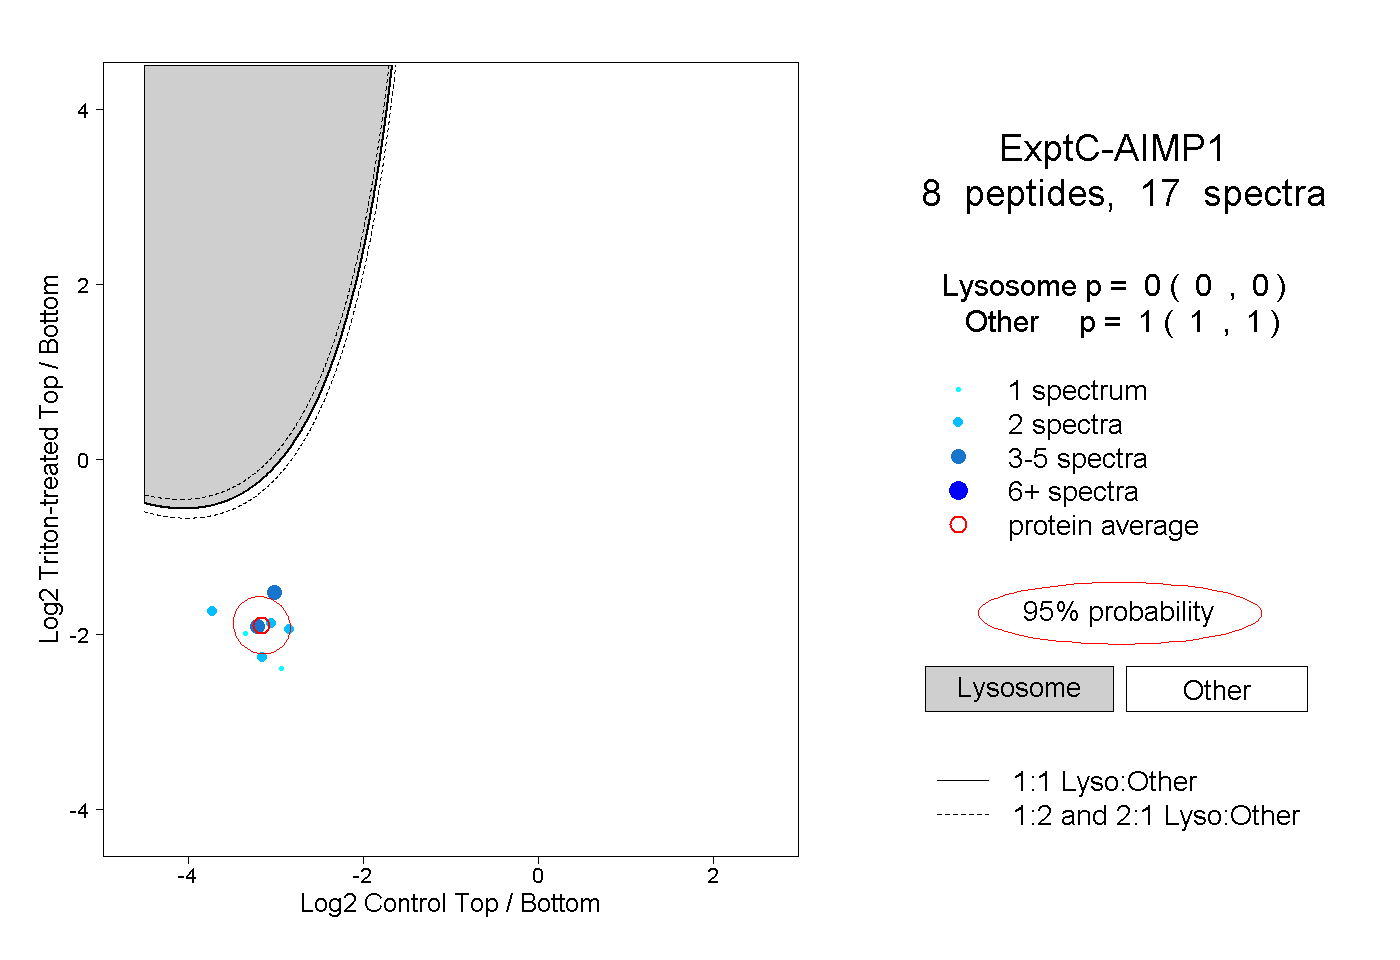
0.000 | 0.000
1.000 | 1.000