 9
9peptides
spectra
0.000 | 0.000
0.000 | 0.000
0.021 | 0.052
0.658 | 0.702
0.000 | 0.000
0.195 | 0.230
0.043 | 0.080
0.000 | 0.005
| Plot | Mito | Lyso | Perox | ER | Golgi | PM | Cytosol | Nucleus | |||||
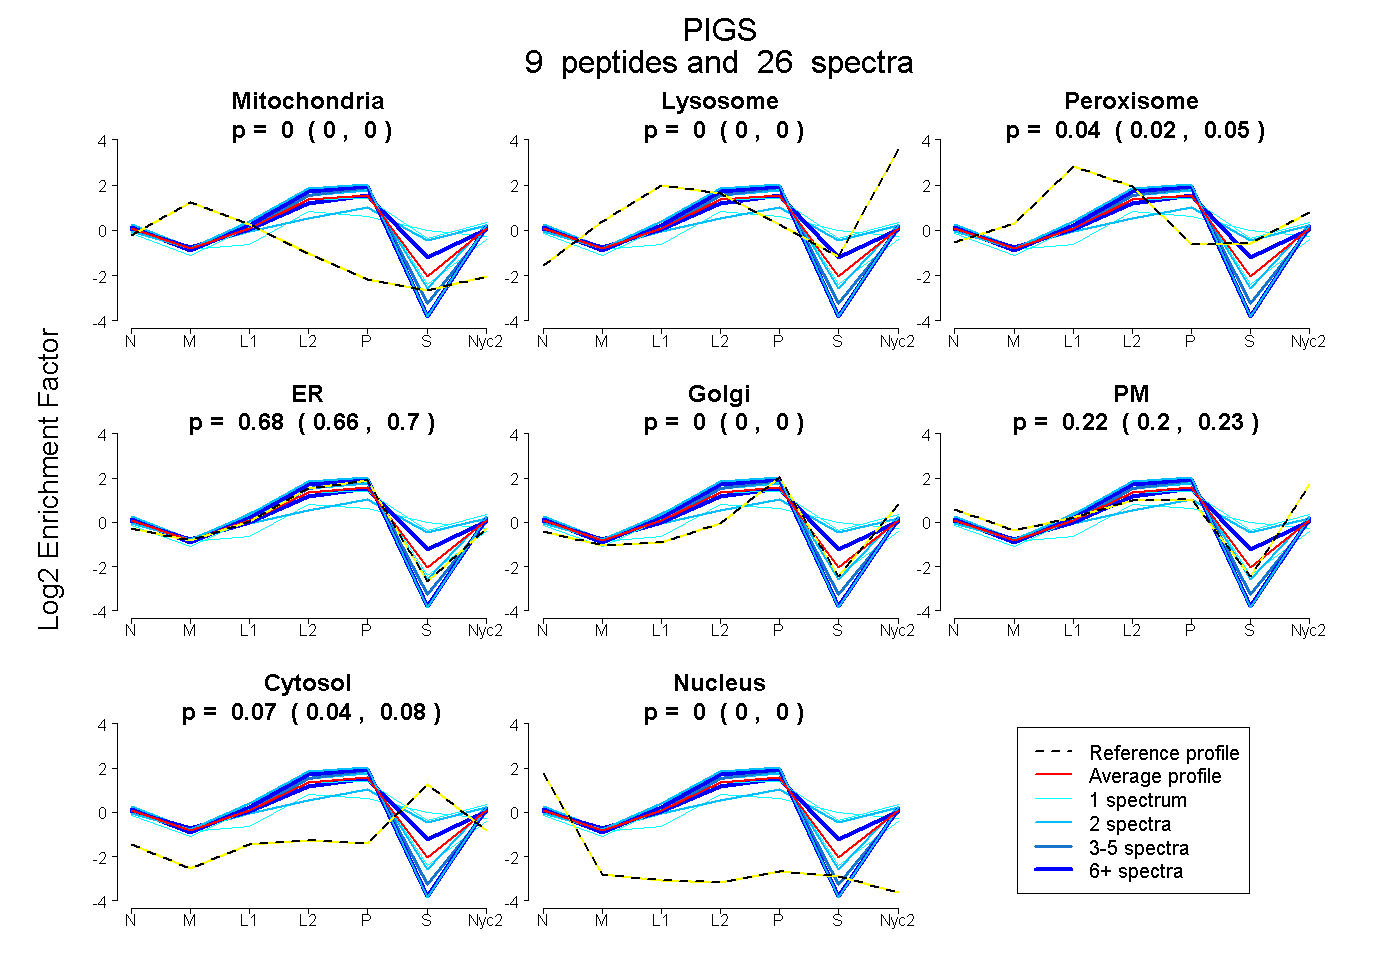
| Expt A |
9 peptides |
26 spectra |
|
0.000 0.000 | 0.000 |
0.000 0.000 | 0.000 |
0.037 0.021 | 0.052 |
0.682 0.658 | 0.702 |
0.000 0.000 | 0.000 |
0.215 0.195 | 0.230 |
0.065 0.043 | 0.080 |
0.000 0.000 | 0.005 |
| 2 spectra, DSVPLDDQEK | 0.000 | 0.000 | 0.026 | 0.722 | 0.000 | 0.252 | 0.000 | 0.000 | ||
| 1 spectrum, TTETYR | 0.000 | 0.084 | 0.119 | 0.502 | 0.000 | 0.065 | 0.230 | 0.000 | ||
| 6 spectra, LMVPVTVVFTR | 0.000 | 0.000 | 0.000 | 0.845 | 0.000 | 0.155 | 0.000 | 0.000 | ||
| 8 spectra, LPFTVVHER | 0.000 | 0.000 | 0.084 | 0.596 | 0.000 | 0.170 | 0.150 | 0.000 | ||
| 1 spectrum, ATAGAAATDLEVVR | 0.000 | 0.000 | 0.097 | 0.332 | 0.000 | 0.183 | 0.389 | 0.000 | ||
| 2 spectra, SEGLMTWELDR | 0.000 | 0.000 | 0.000 | 0.877 | 0.000 | 0.123 | 0.000 | 0.000 | ||
| 1 spectrum, CLLSGPK | 0.000 | 0.000 | 0.034 | 0.920 | 0.000 | 0.022 | 0.000 | 0.025 | ||
| 2 spectra, DGAPVATNAFHSPR | 0.000 | 0.000 | 0.110 | 0.253 | 0.019 | 0.330 | 0.288 | 0.000 | ||
| 3 spectra, EAFNIIGR | 0.000 | 0.000 | 0.000 | 0.858 | 0.000 | 0.142 | 0.000 | 0.000 |
| Plot | Mito | Lyso or Perox | ER | Golgi | PM | Cytosol | Nucleus | ||||||
| Expt B |
1 peptide |
1 spectrum |
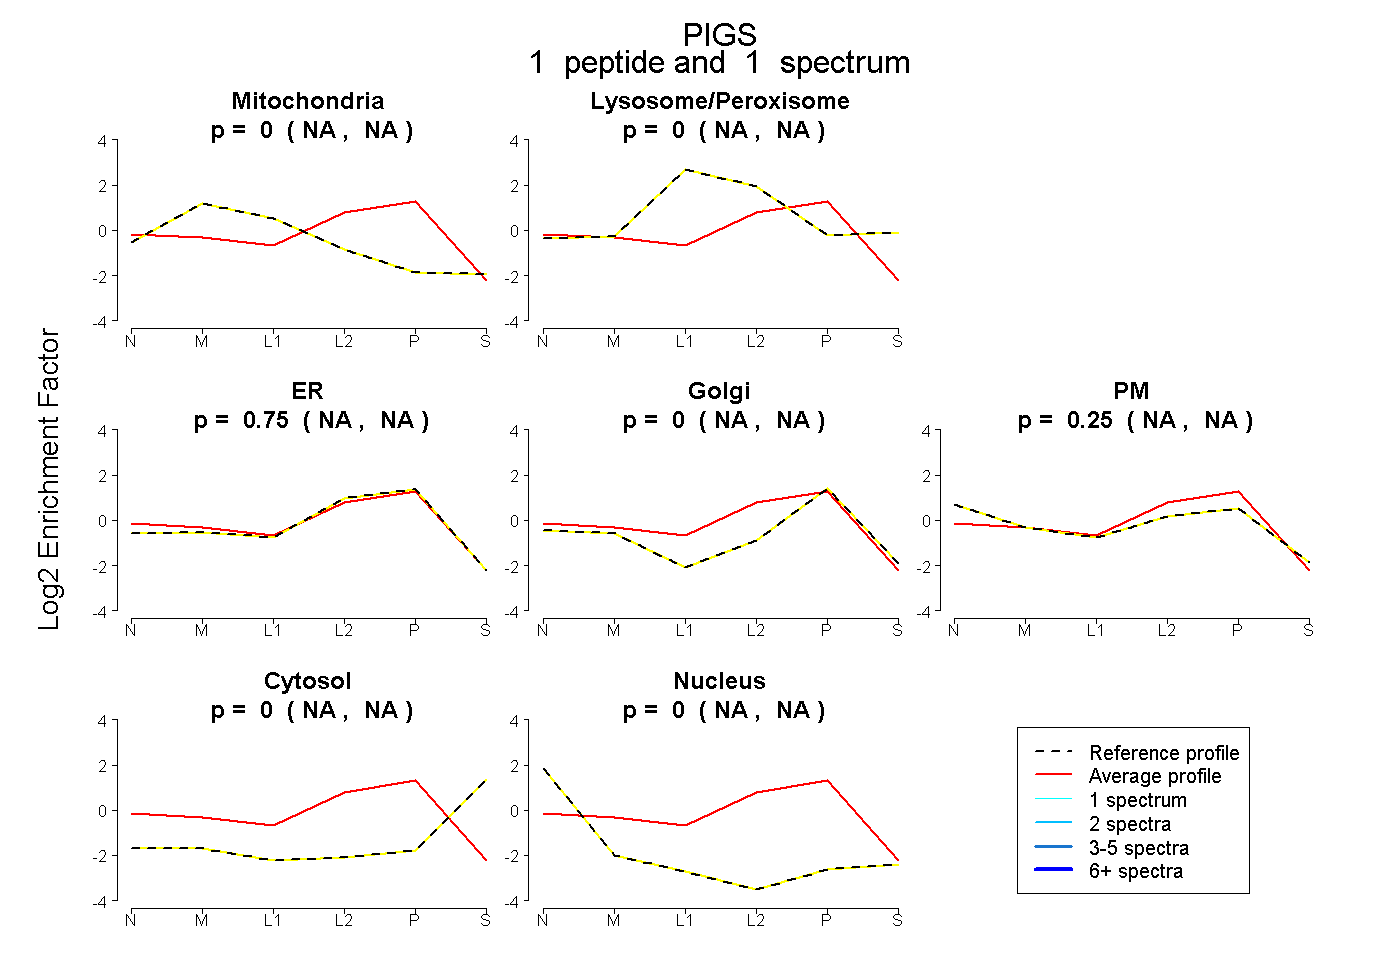 |
0.000 NA | NA |
0.001 NA | NA |
0.748 NA | NA |
0.000 NA | NA |
0.250 NA | NA |
0.000 NA | NA |
0.000 NA | NA |
|||
| Plot | Lyso | Other | |||||||||||
| Expt C |
3 peptides |
4 spectra |
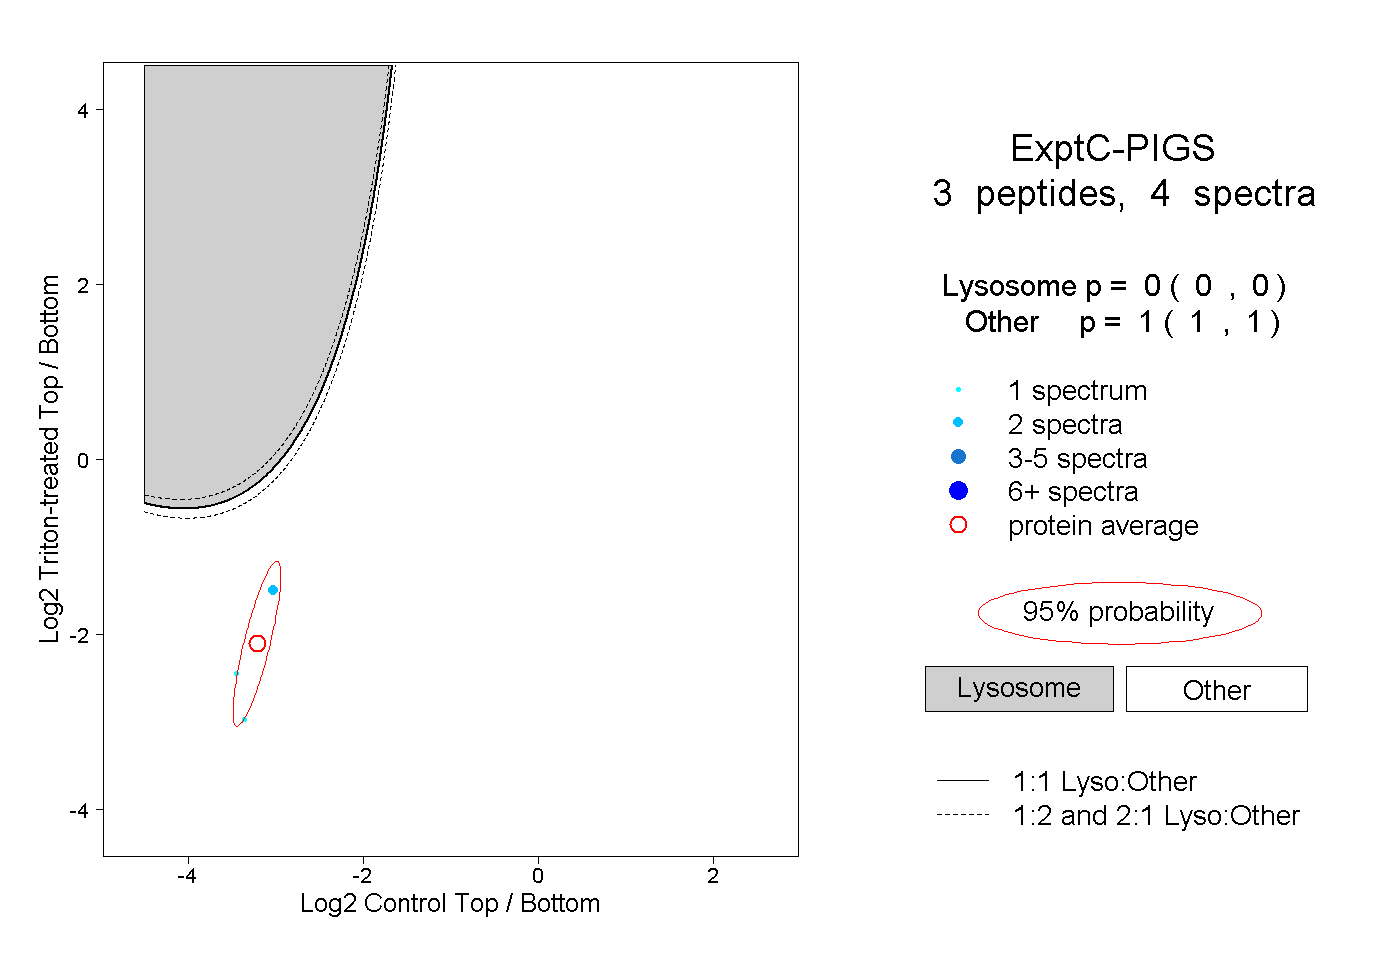 |
0.000 0.000 | 0.000 |
1.000 1.000 | 1.000 |
||||||||
| Plot | Lyso | Other | |||||||||||
| Expt D |
1 peptide |
1 spectrum |
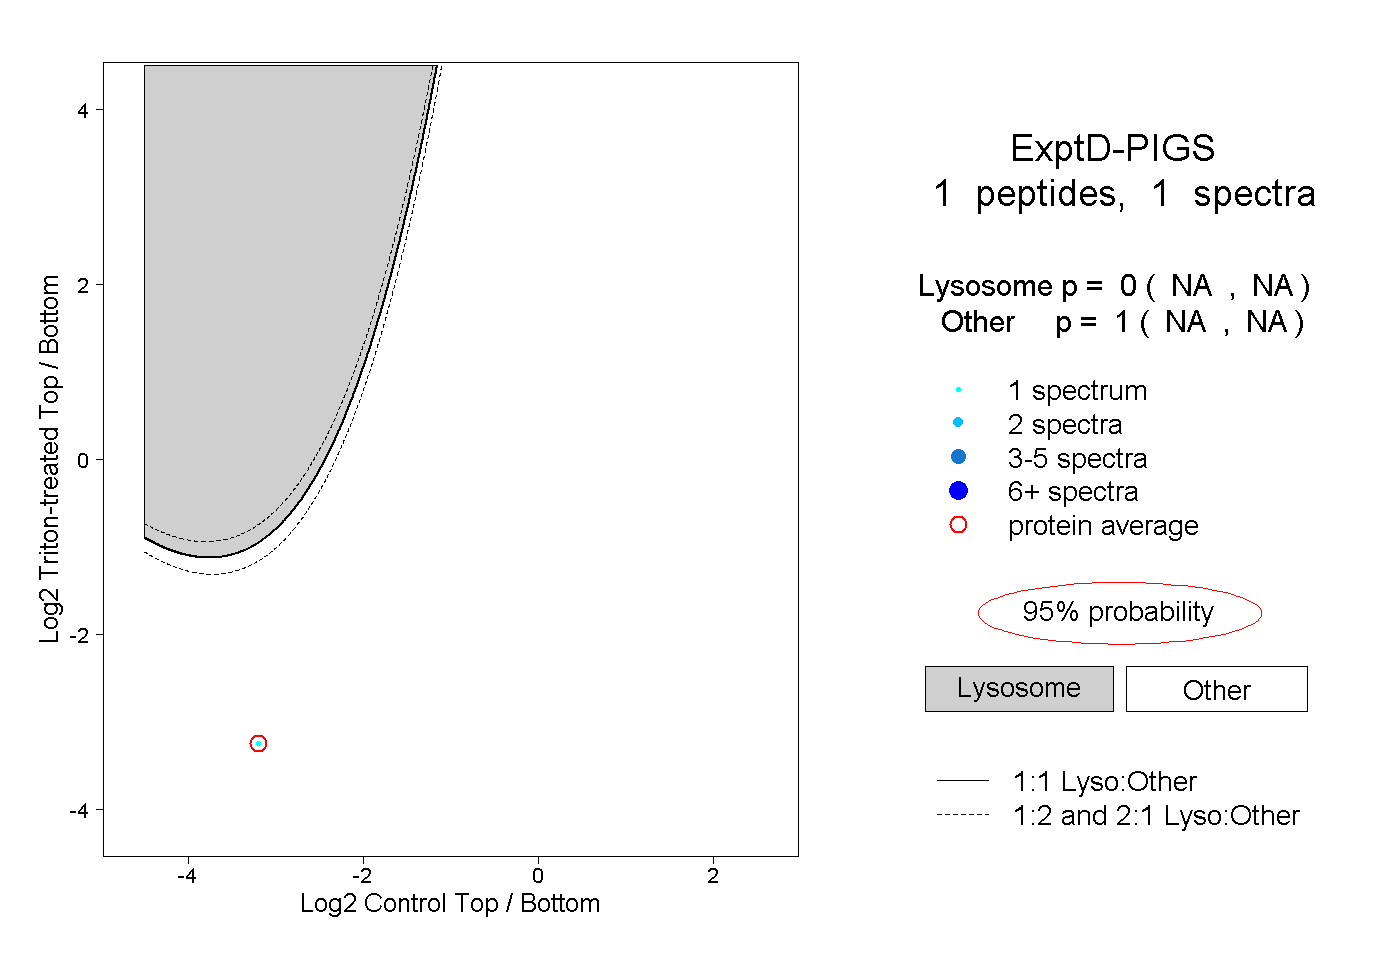 |
0.000 NA | NA |
1.000 NA | NA |