 7
7peptides
spectra
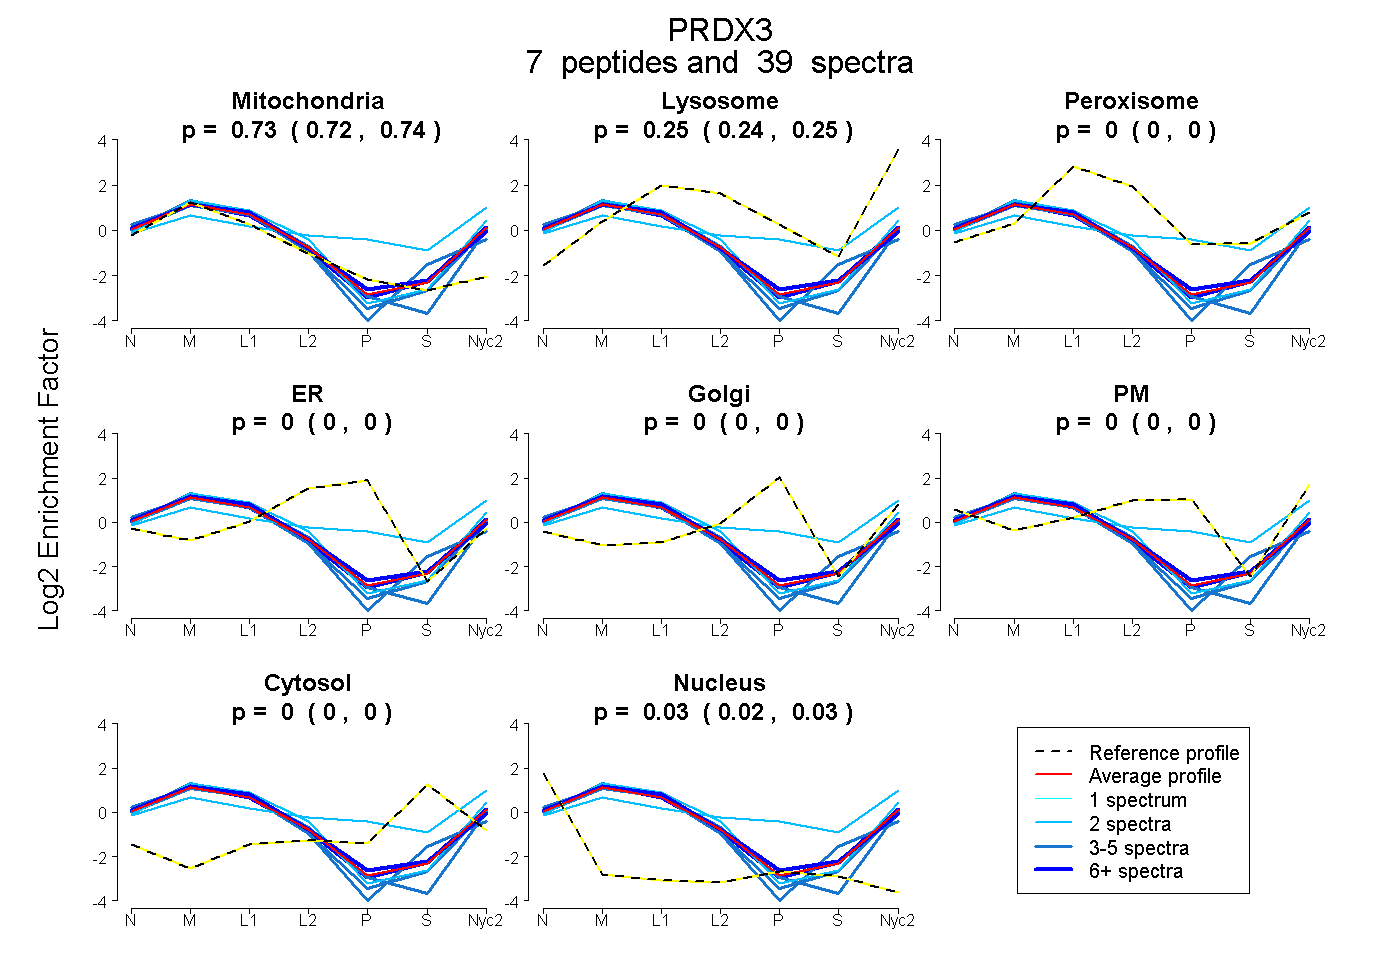
0.717 | 0.740
0.236 | 0.253
0.000 | 0.000
0.000 | 0.000
0.000 | 0.000
0.000 | 0.000
0.000 | 0.000
0.021 | 0.029
6peptides
spectra
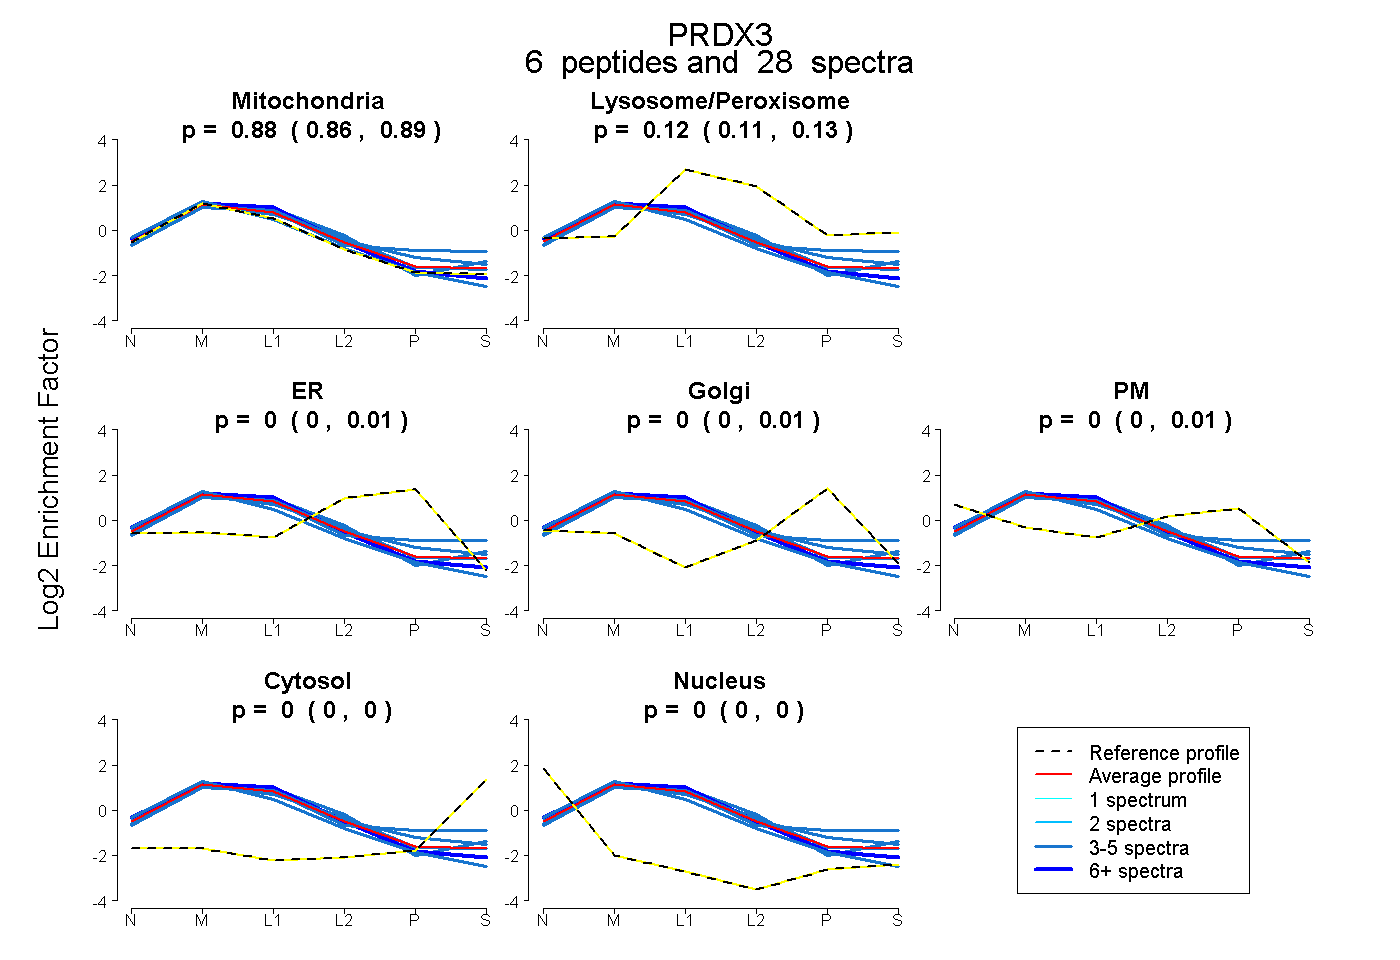
0.862 | 0.888
0.106 | 0.128
0.000 | 0.011
0.000 | 0.009
0.000 | 0.009
0.000 | 0.000
0.000 | 0.000
7peptides
spectra
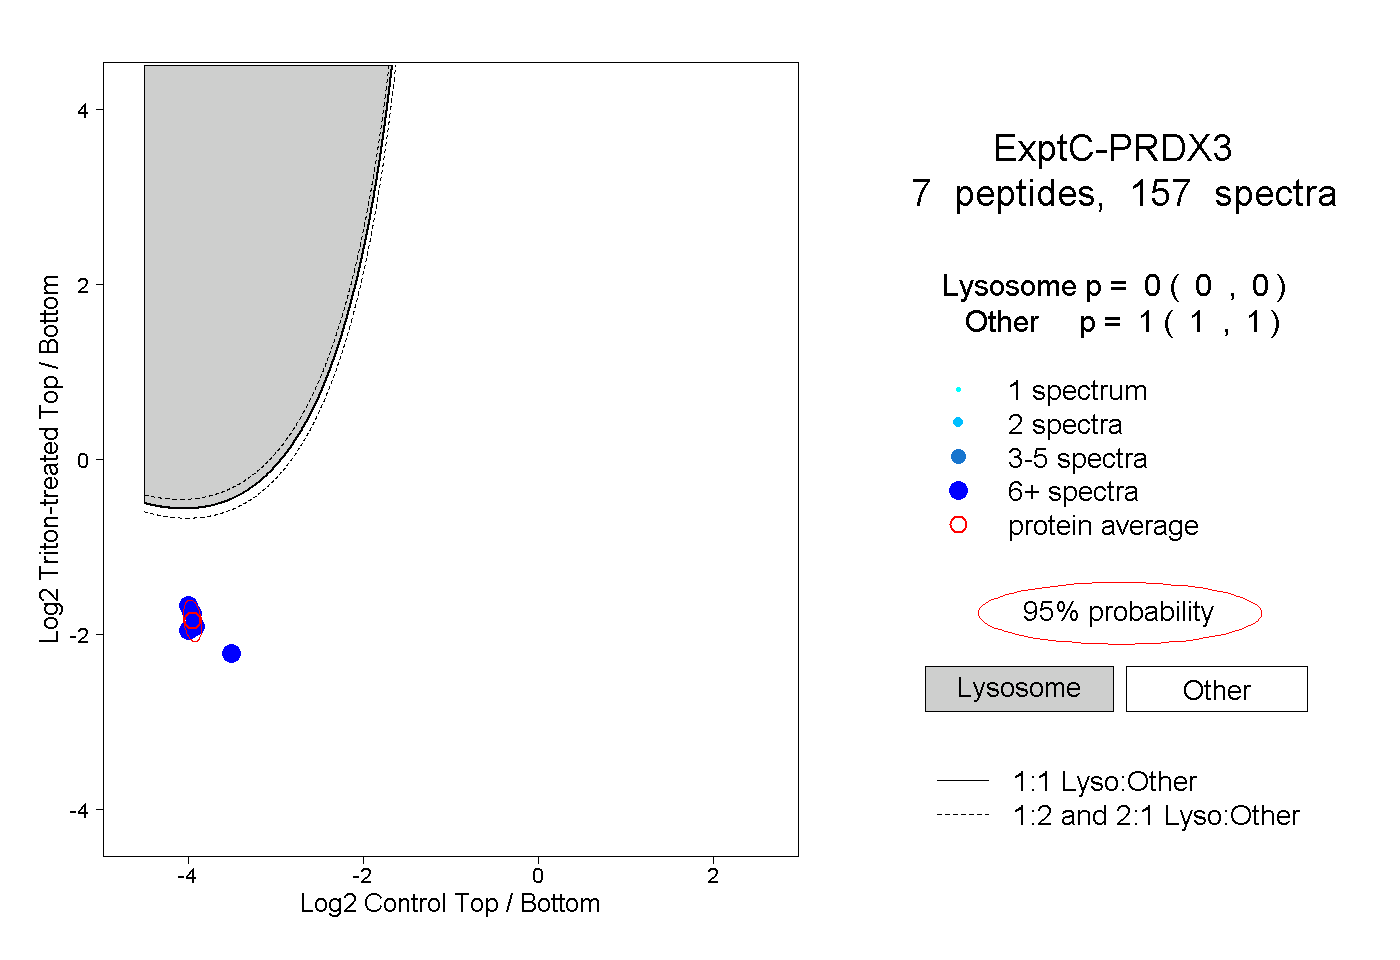
0.000 | 0.000
1.000 | 1.000
3peptides
spectra
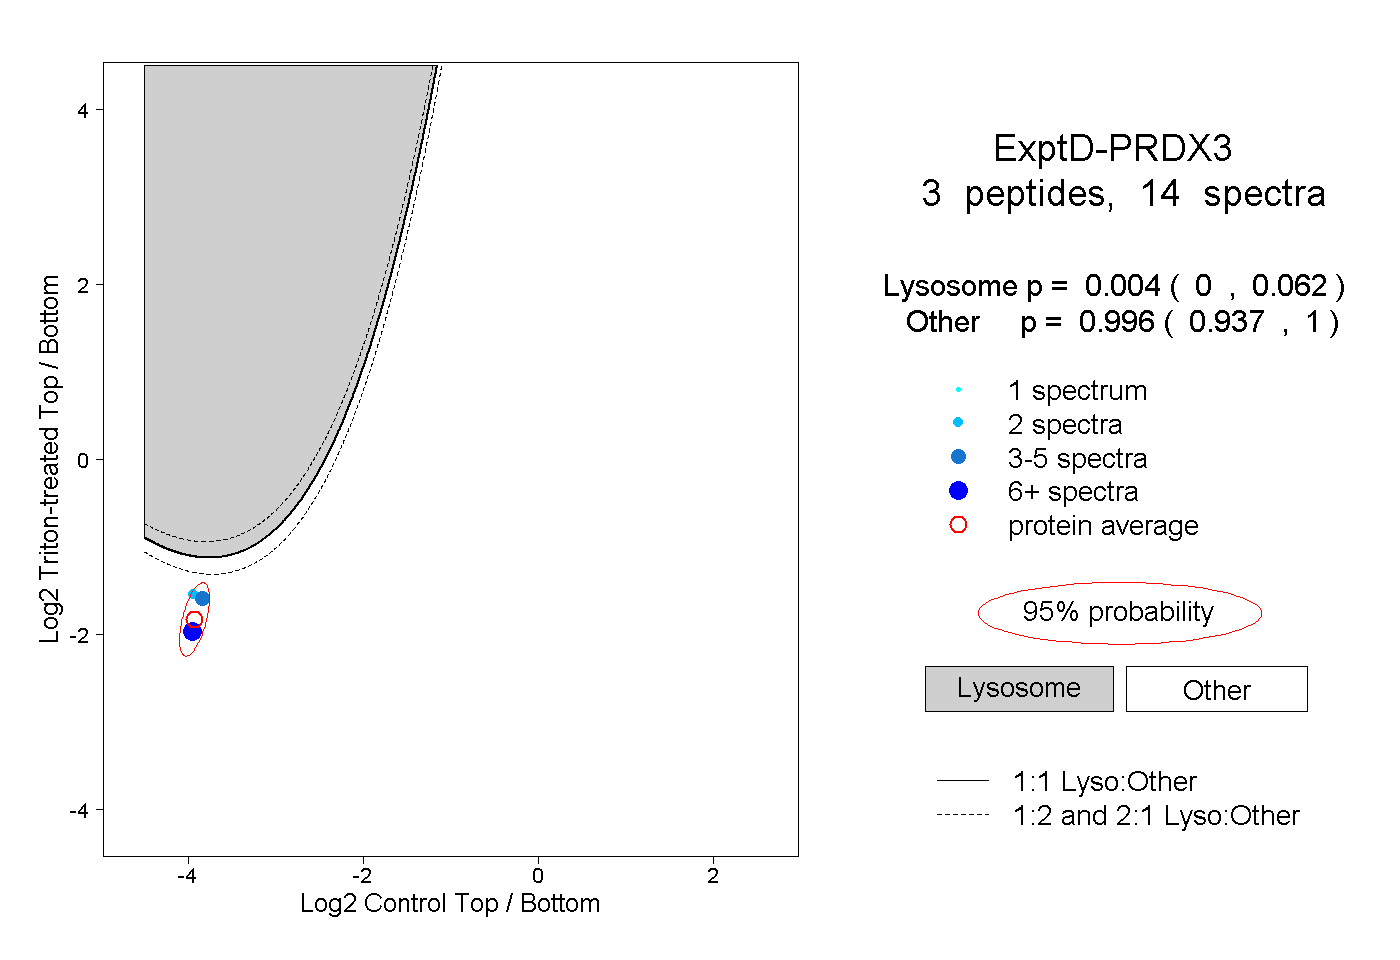
0.000 | 0.062
0.937 | 1.000