55
55peptides
spectra
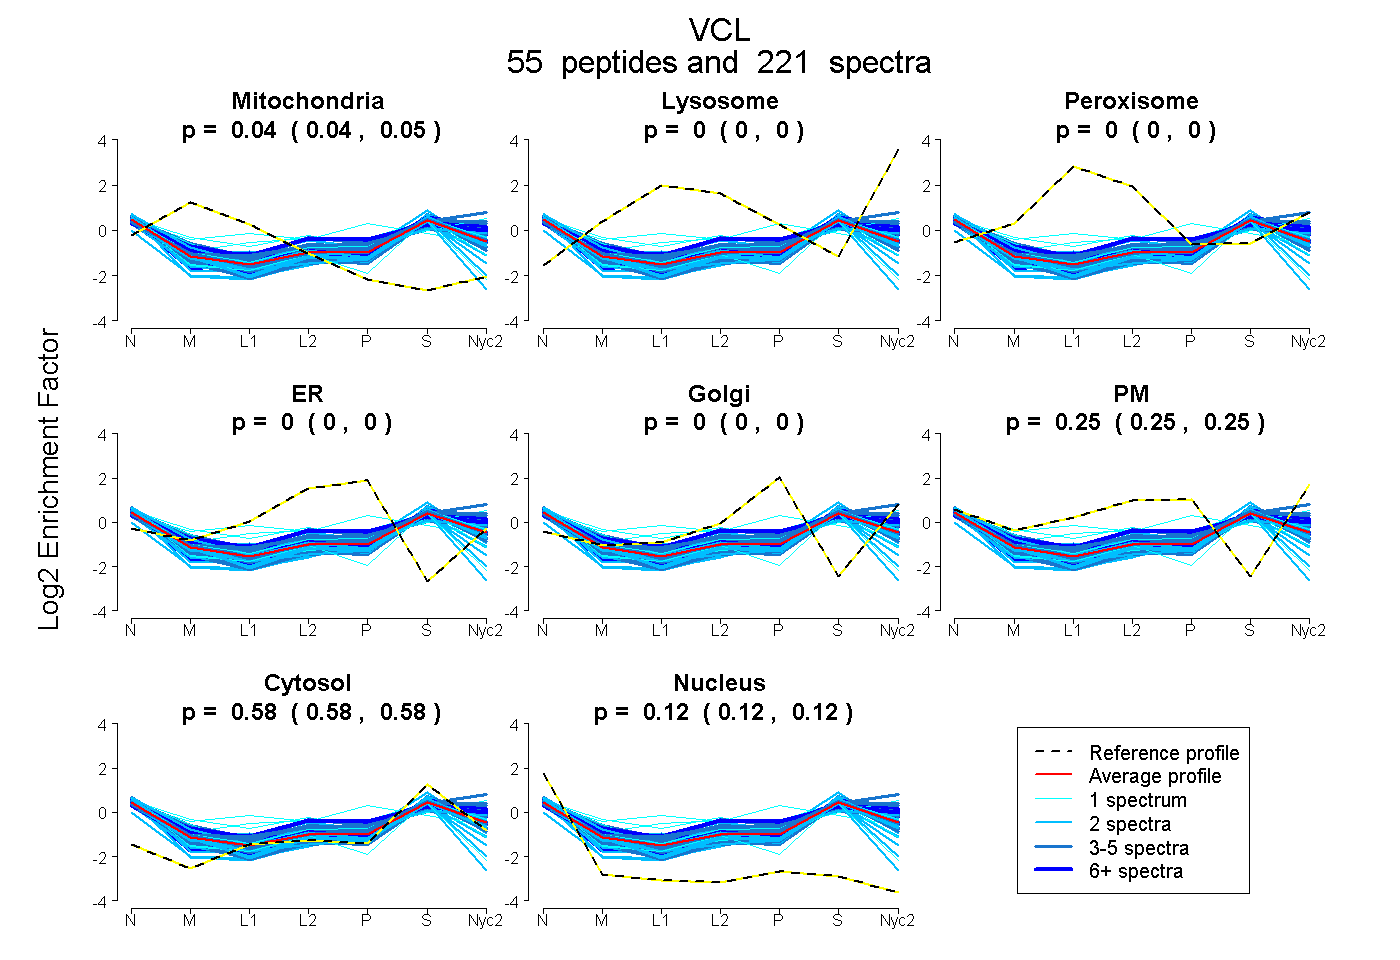
0.042 | 0.045
0.000 | 0.000
0.000 | 0.000
0.000 | 0.000
0.000 | 0.000
0.252 | 0.254
0.580 | 0.582
0.121 | 0.122
18peptides
spectra
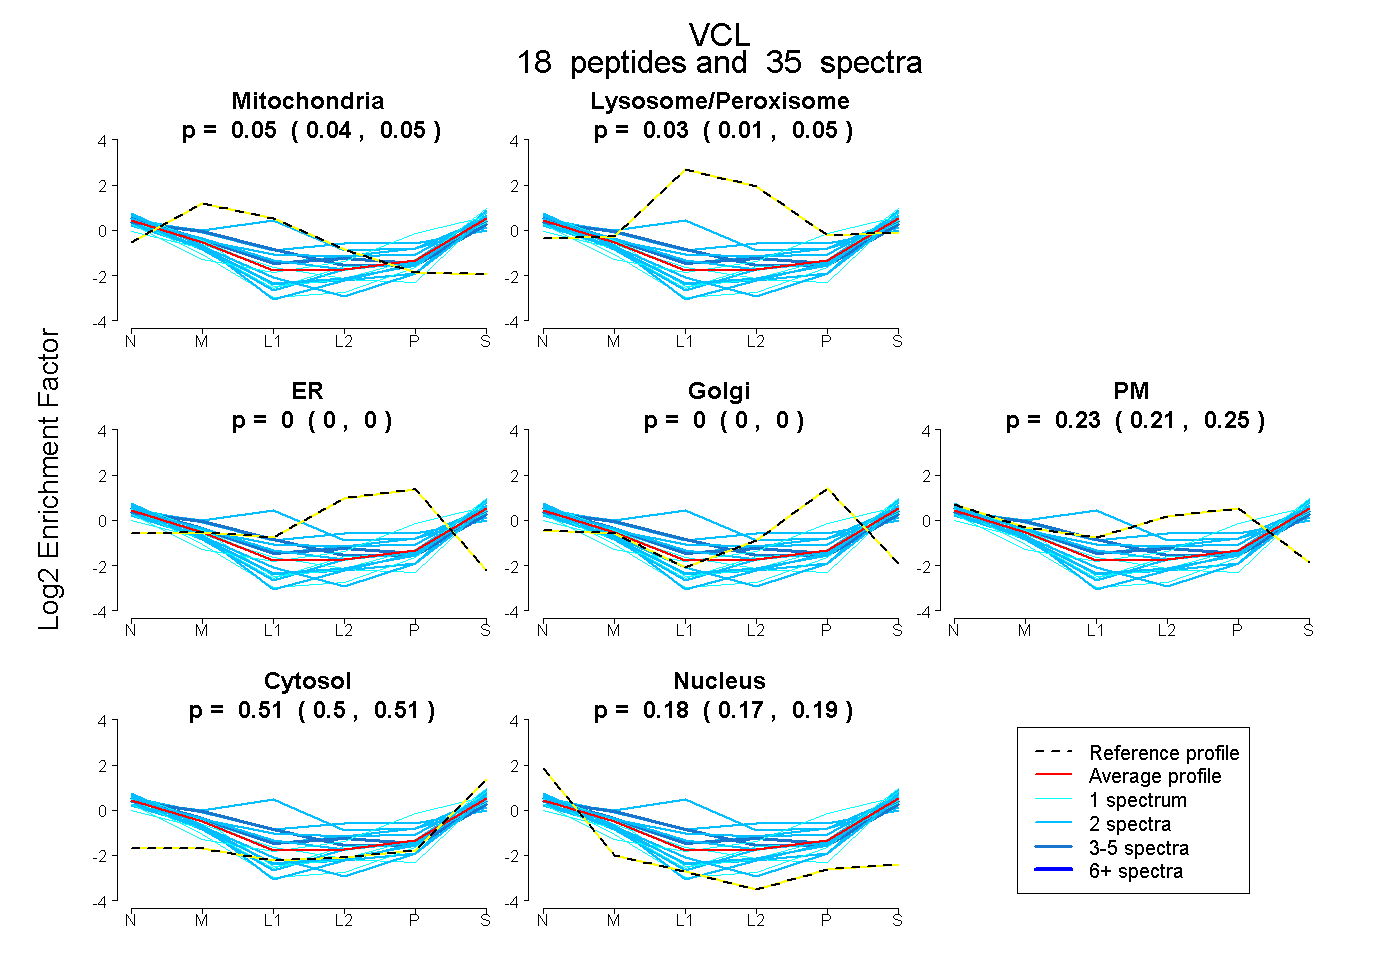
0.035 | 0.054
0.015 | 0.046
0.000 | 0.000
0.000 | 0.000
0.214 | 0.252
0.500 | 0.514
0.170 | 0.188