18
18peptides
spectra
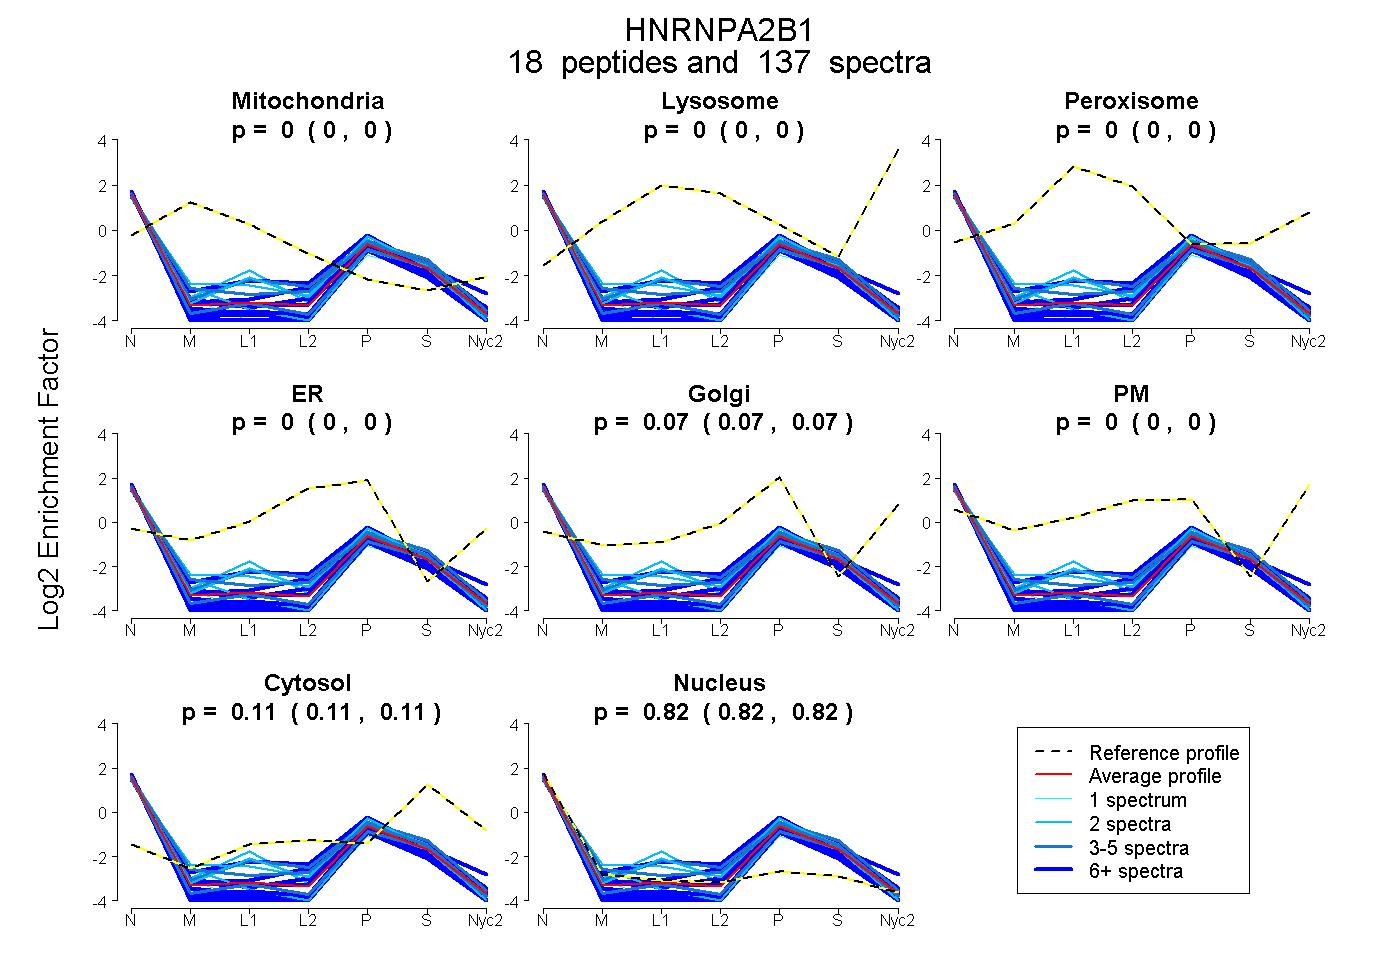
0.000 | 0.000
0.000 | 0.000
0.000 | 0.000
0.000 | 0.000
0.069 | 0.073
0.000 | 0.000
0.108 | 0.111
0.817 | 0.821
11peptides
spectra
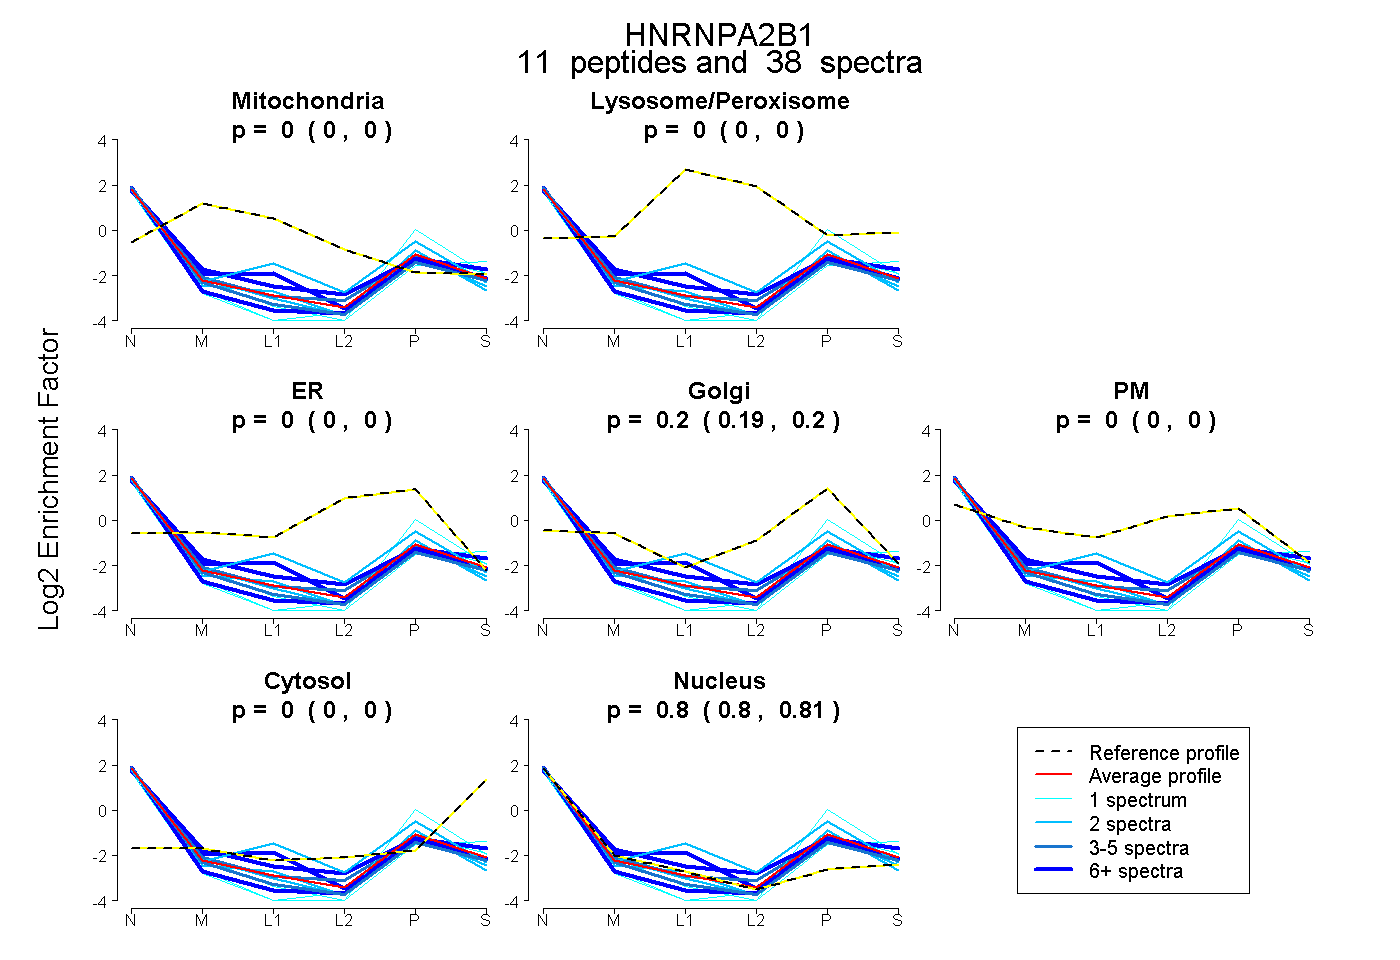
0.000 | 0.000
0.000 | 0.000
0.000 | 0.000
0.191 | 0.202
0.000 | 0.000
0.000 | 0.000
0.797 | 0.808