 1
1peptide
spectra
0.000 | 0.000
0.000 | 0.000
0.035 | 0.087
0.764 | 0.831
0.000 | 0.000
0.000 | 0.000
0.114 | 0.156
0.000 | 0.000
1peptide
spectra
0.000 | 0.000
1.000 | 1.000
| Plot | Mito | Lyso | Perox | ER | Golgi | PM | Cytosol | Nucleus | |||||
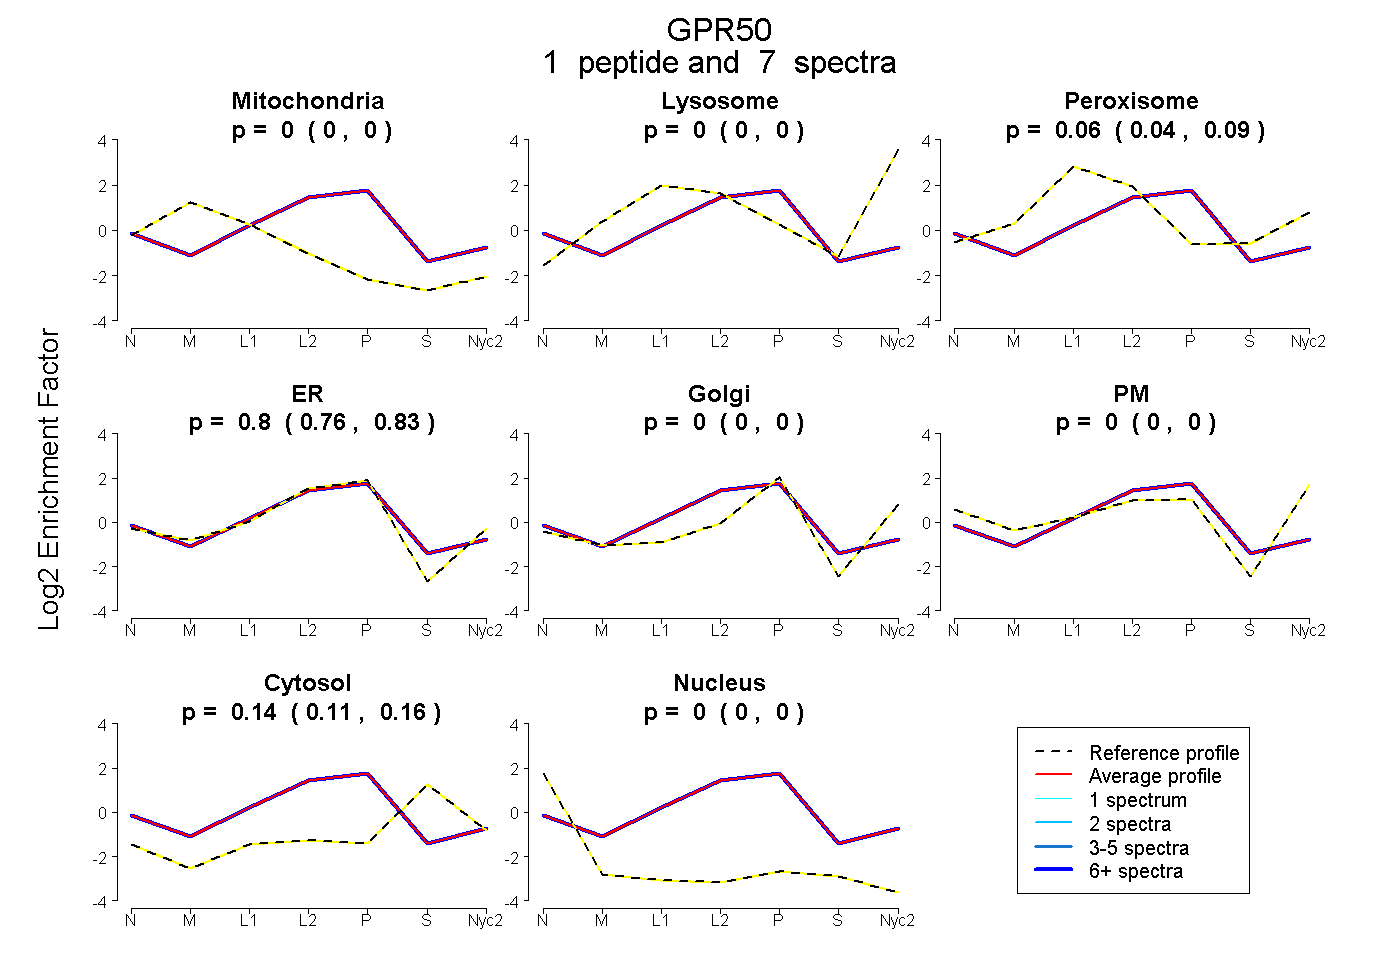
| Expt A |
1 peptide |
7 spectra |
|
0.000 0.000 | 0.000 |
0.000 0.000 | 0.000 |
0.062 0.035 | 0.087 |
0.801 0.764 | 0.831 |
0.000 0.000 | 0.000 |
0.000 0.000 | 0.000 |
0.137 0.114 | 0.156 |
0.000 0.000 | 0.000 |
||
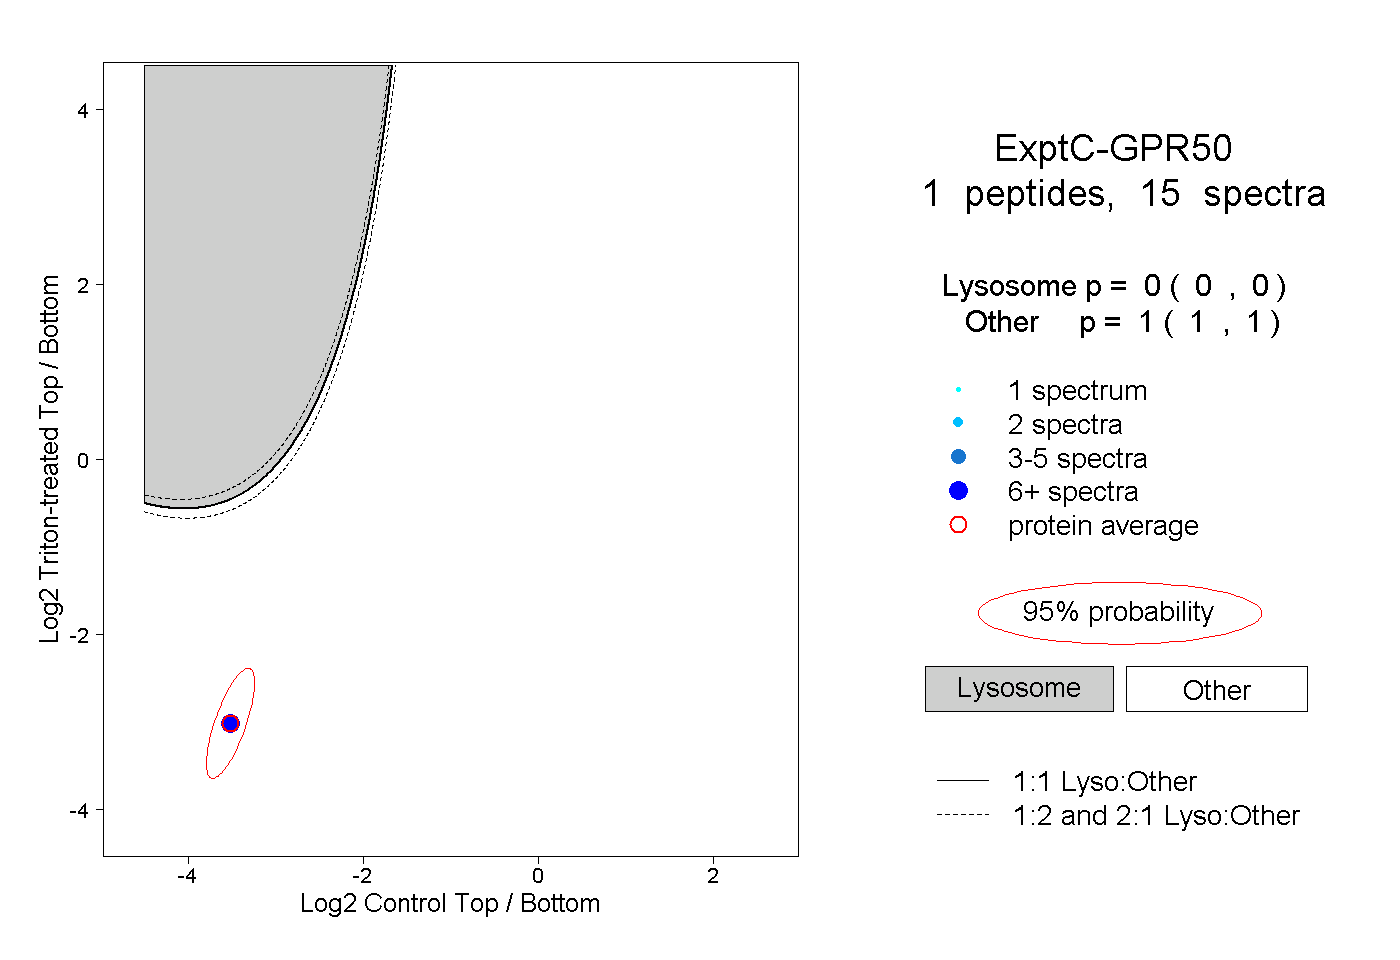
| Plot | Lyso | Other | |||||||||||
| Expt C |
1 peptide |
15 spectra |
|
0.000 0.000 | 0.000 |
1.000 1.000 | 1.000 |