 10
10peptides
spectra
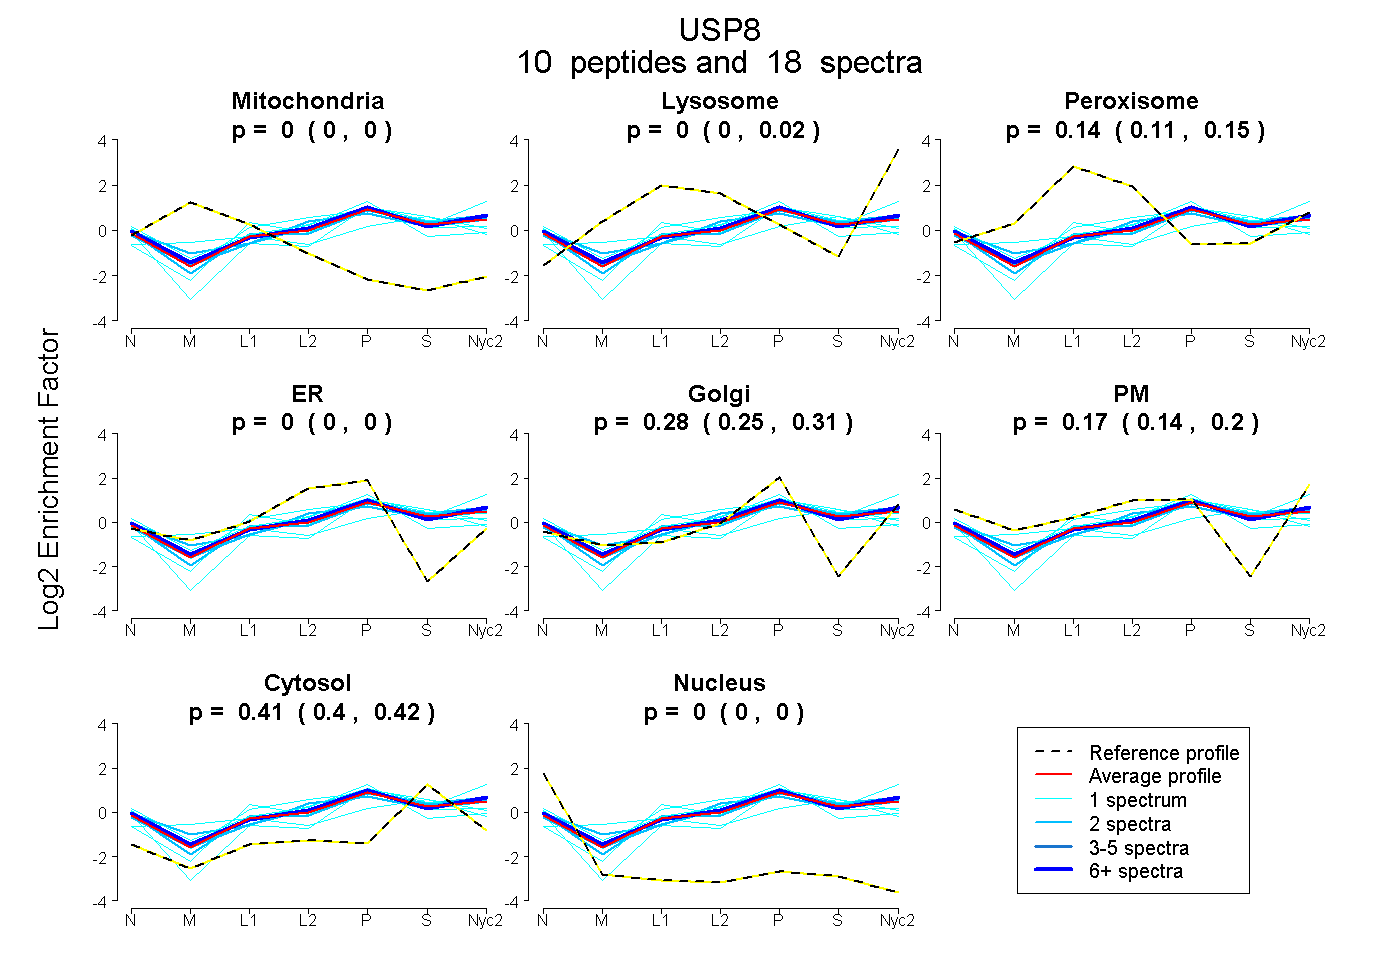
0.000 | 0.000
0.000 | 0.016
0.115 | 0.150
0.000 | 0.000
0.251 | 0.305
0.138 | 0.200
0.397 | 0.418
0.000 | 0.000
4peptides
spectra
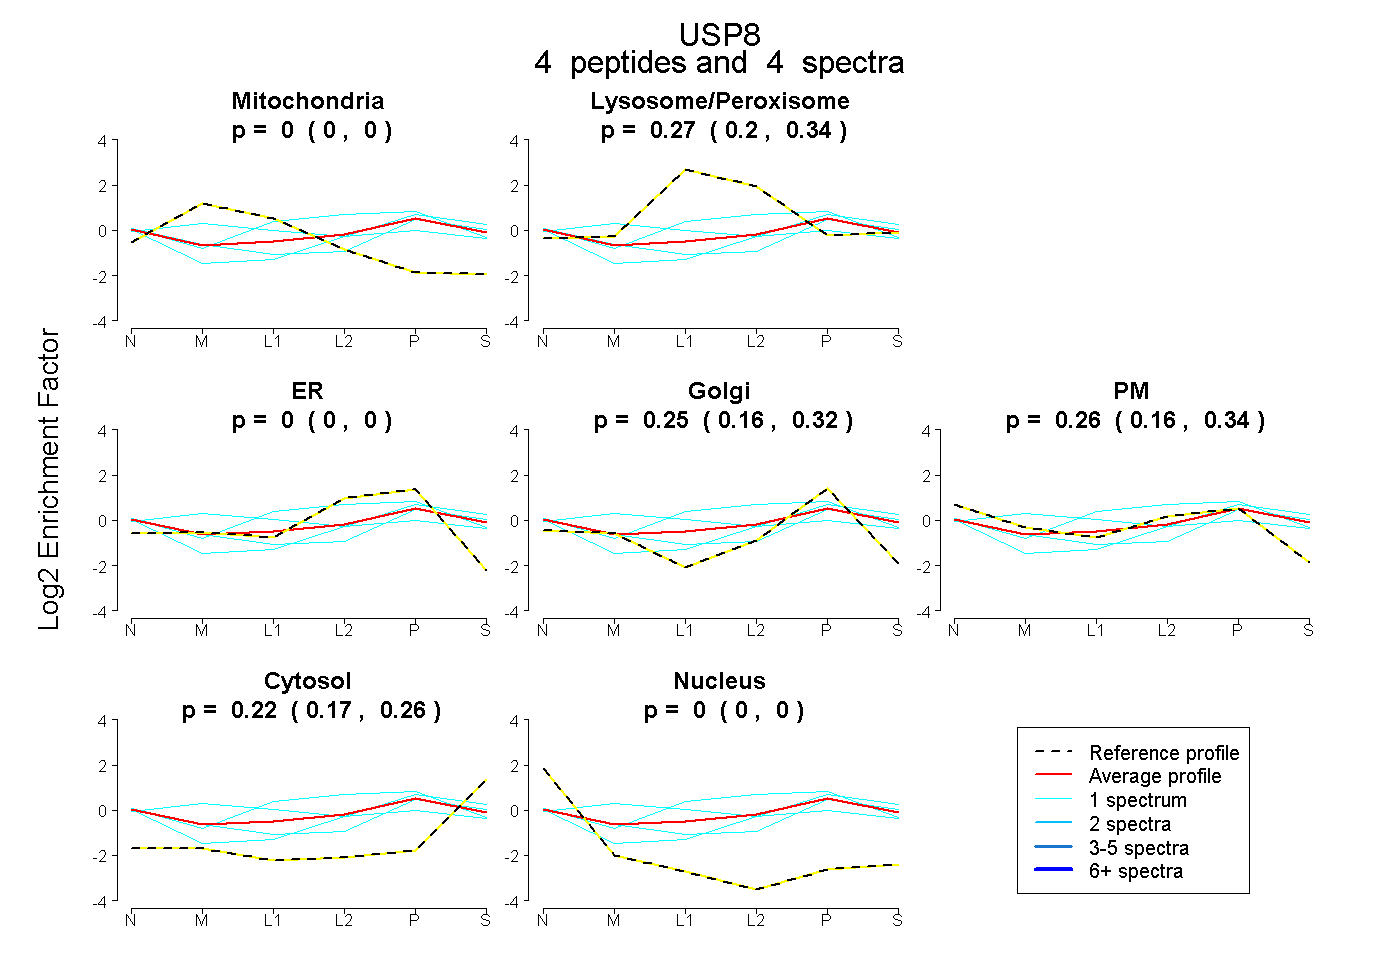
0.000 | 0.000
0.198 | 0.342
0.000 | 0.000
0.158 | 0.325
0.158 | 0.340
0.174 | 0.262
0.000 | 0.000
18peptides
spectra
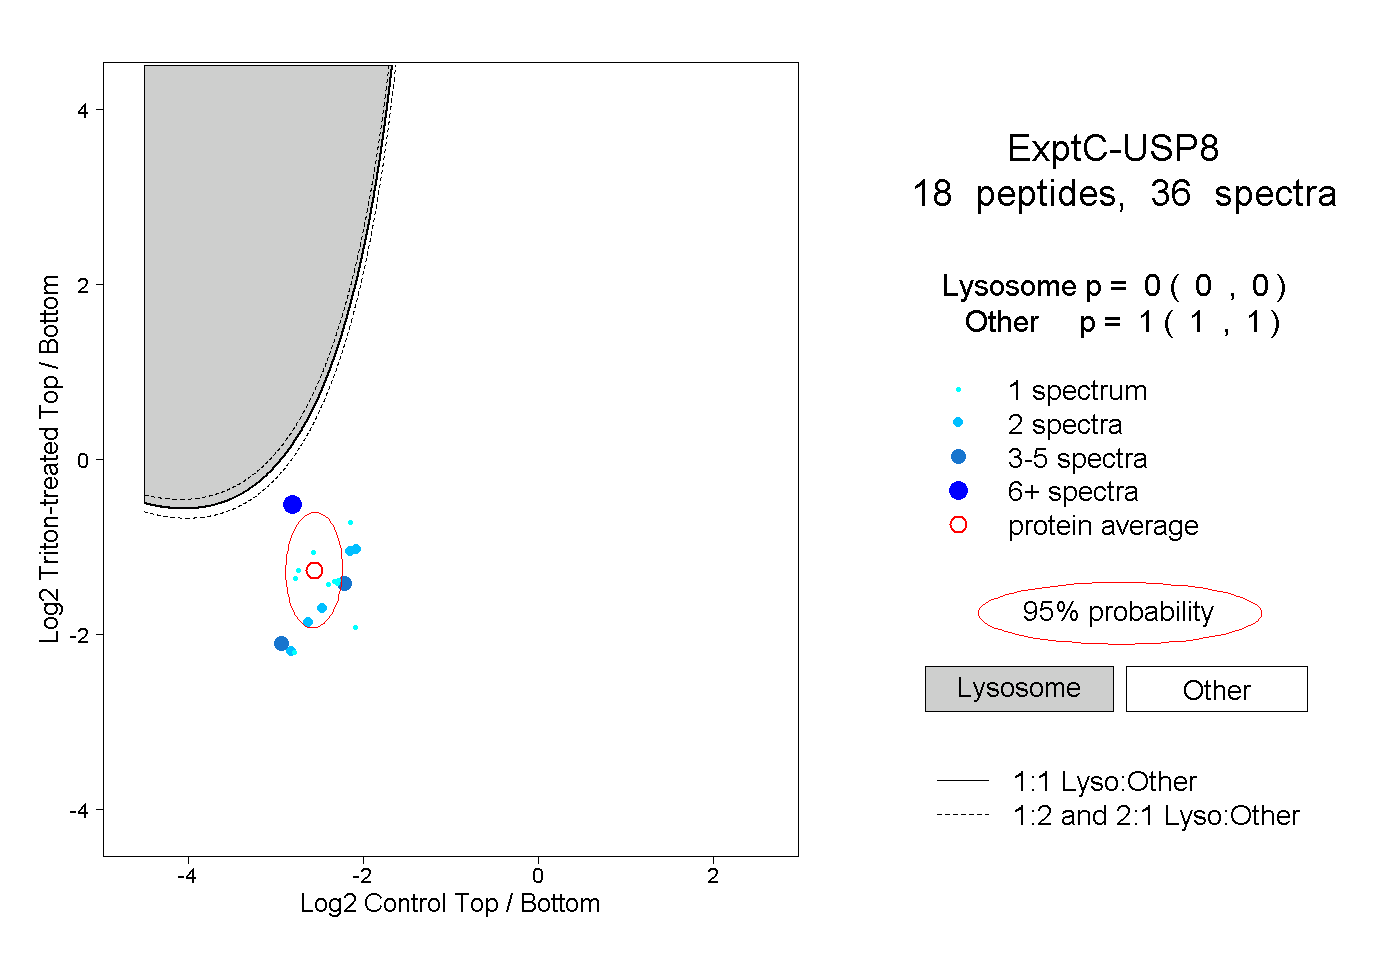
0.000 | 0.000
1.000 | 1.000