 10
10peptides
spectra
0.000 | 0.000
0.000 | 0.016
0.115 | 0.150
0.000 | 0.000
0.251 | 0.305
0.138 | 0.200
0.397 | 0.418
0.000 | 0.000
| Plot | Mito | Lyso | Perox | ER | Golgi | PM | Cytosol | Nucleus | |||||
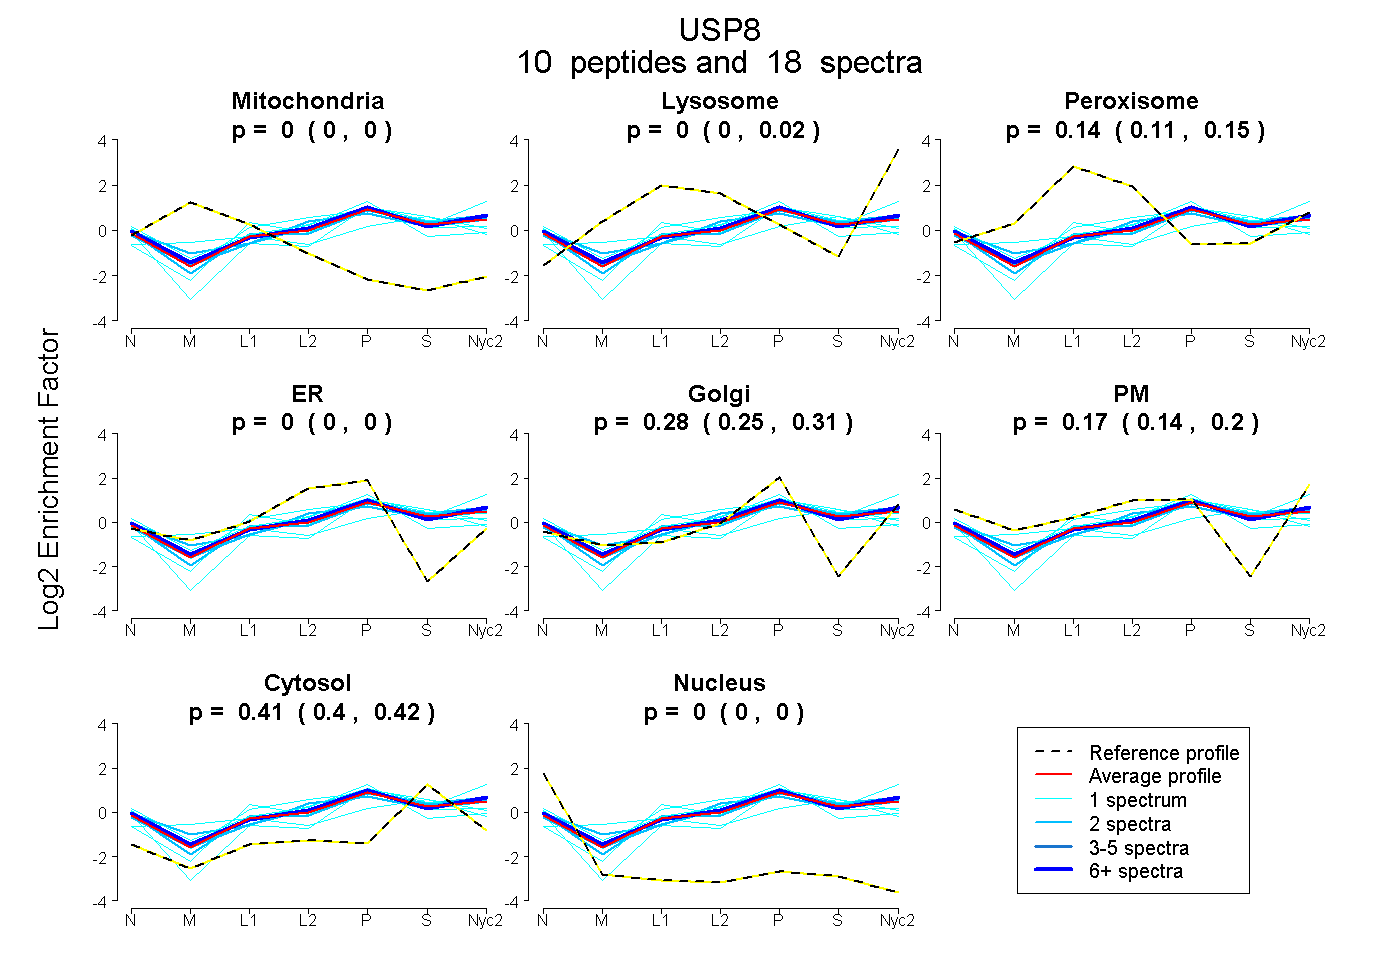
| Expt A |
10 peptides |
18 spectra |
|
0.000 0.000 | 0.000 |
0.003 0.000 | 0.016 |
0.136 0.115 | 0.150 |
0.000 0.000 | 0.000 |
0.280 0.251 | 0.305 |
0.173 0.138 | 0.200 |
0.408 0.397 | 0.418 |
0.000 0.000 | 0.000 |
| 2 spectra, LPPVLLVHLK | 0.000 | 0.034 | 0.076 | 0.000 | 0.284 | 0.179 | 0.427 | 0.000 | ||
| 1 spectrum, LPEDHR | 0.000 | 0.000 | 0.224 | 0.044 | 0.278 | 0.000 | 0.454 | 0.000 | ||
| 1 spectrum, AIEEAER | 0.000 | 0.000 | 0.053 | 0.202 | 0.102 | 0.227 | 0.416 | 0.000 | ||
| 6 spectra, RPAVTPTVNR | 0.000 | 0.030 | 0.089 | 0.000 | 0.243 | 0.257 | 0.381 | 0.000 | ||
| 2 spectra, DLLLGTTLR | 0.000 | 0.044 | 0.058 | 0.000 | 0.184 | 0.252 | 0.462 | 0.000 | ||
| 2 spectra, FDDHEVSDISVSSVR | 0.000 | 0.000 | 0.073 | 0.060 | 0.062 | 0.388 | 0.416 | 0.000 | ||
| 1 spectrum, IVPGLPLGWAK | 0.000 | 0.000 | 0.092 | 0.274 | 0.198 | 0.110 | 0.326 | 0.000 | ||
| 1 spectrum, AYVLYMK | 0.027 | 0.000 | 0.242 | 0.000 | 0.240 | 0.000 | 0.491 | 0.000 | ||
| 1 spectrum, DFTENQHK | 0.000 | 0.156 | 0.026 | 0.000 | 0.000 | 0.447 | 0.371 | 0.000 | ||
| 1 spectrum, FLDPITGTFR | 0.000 | 0.000 | 0.000 | 0.000 | 0.407 | 0.049 | 0.544 | 0.000 |
| Plot | Mito | Lyso or Perox | ER | Golgi | PM | Cytosol | Nucleus | ||||||
| Expt B |
4 peptides |
4 spectra |
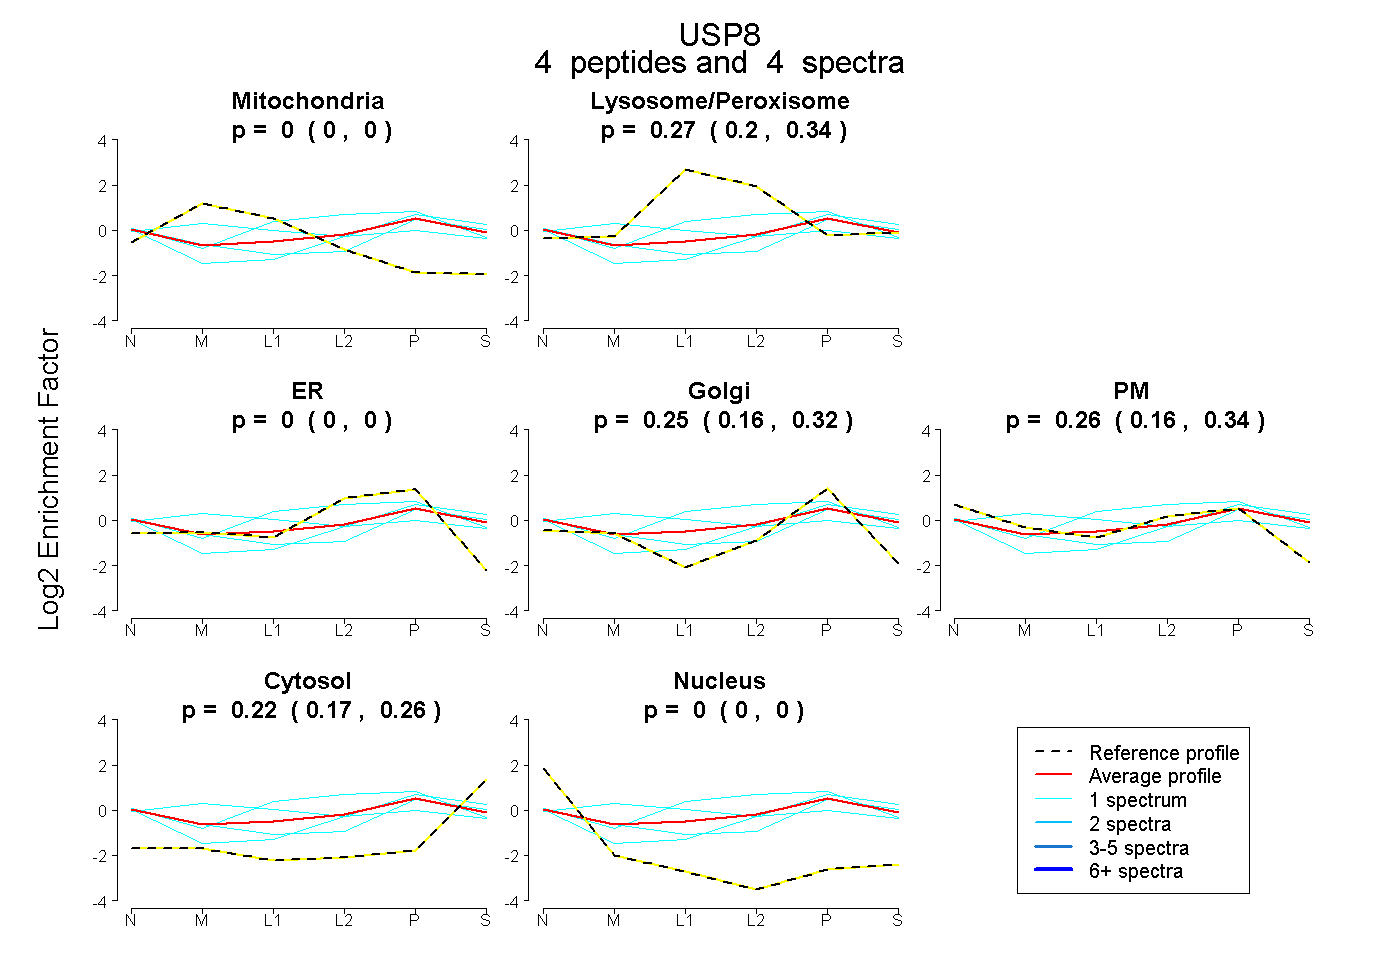 |
0.000 0.000 | 0.000 |
0.274 0.198 | 0.342 |
0.000 0.000 | 0.000 |
0.247 0.158 | 0.325 |
0.258 0.158 | 0.340 |
0.220 0.174 | 0.262 |
0.000 0.000 | 0.000 |
|||
| Plot | Lyso | Other | |||||||||||
| Expt C |
18 peptides |
36 spectra |
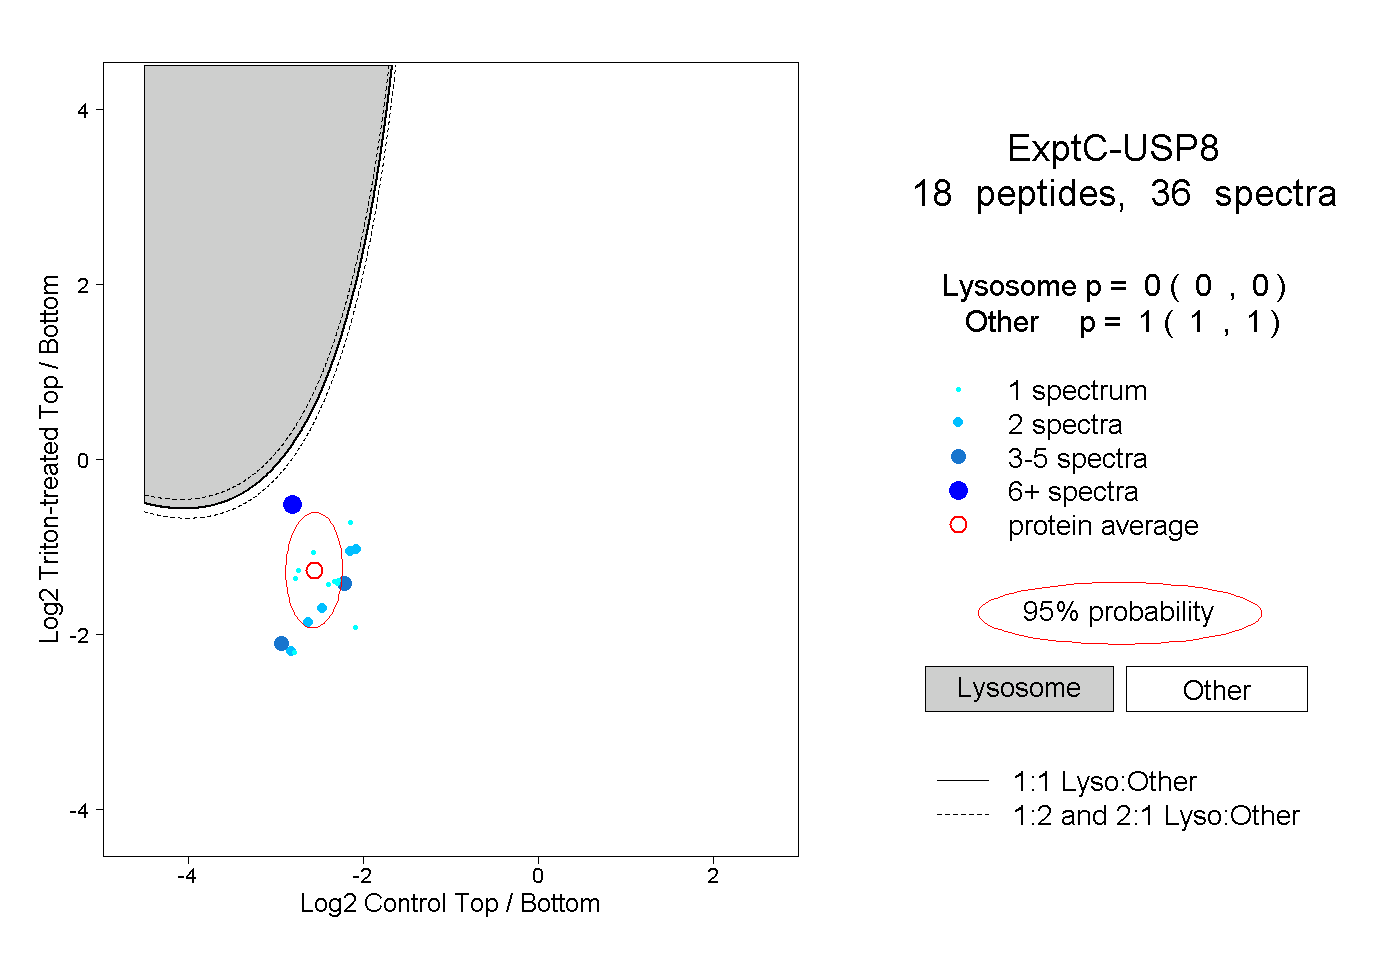 |
0.000 0.000 | 0.000 |
1.000 1.000 | 1.000 |