 10
10peptides
spectra
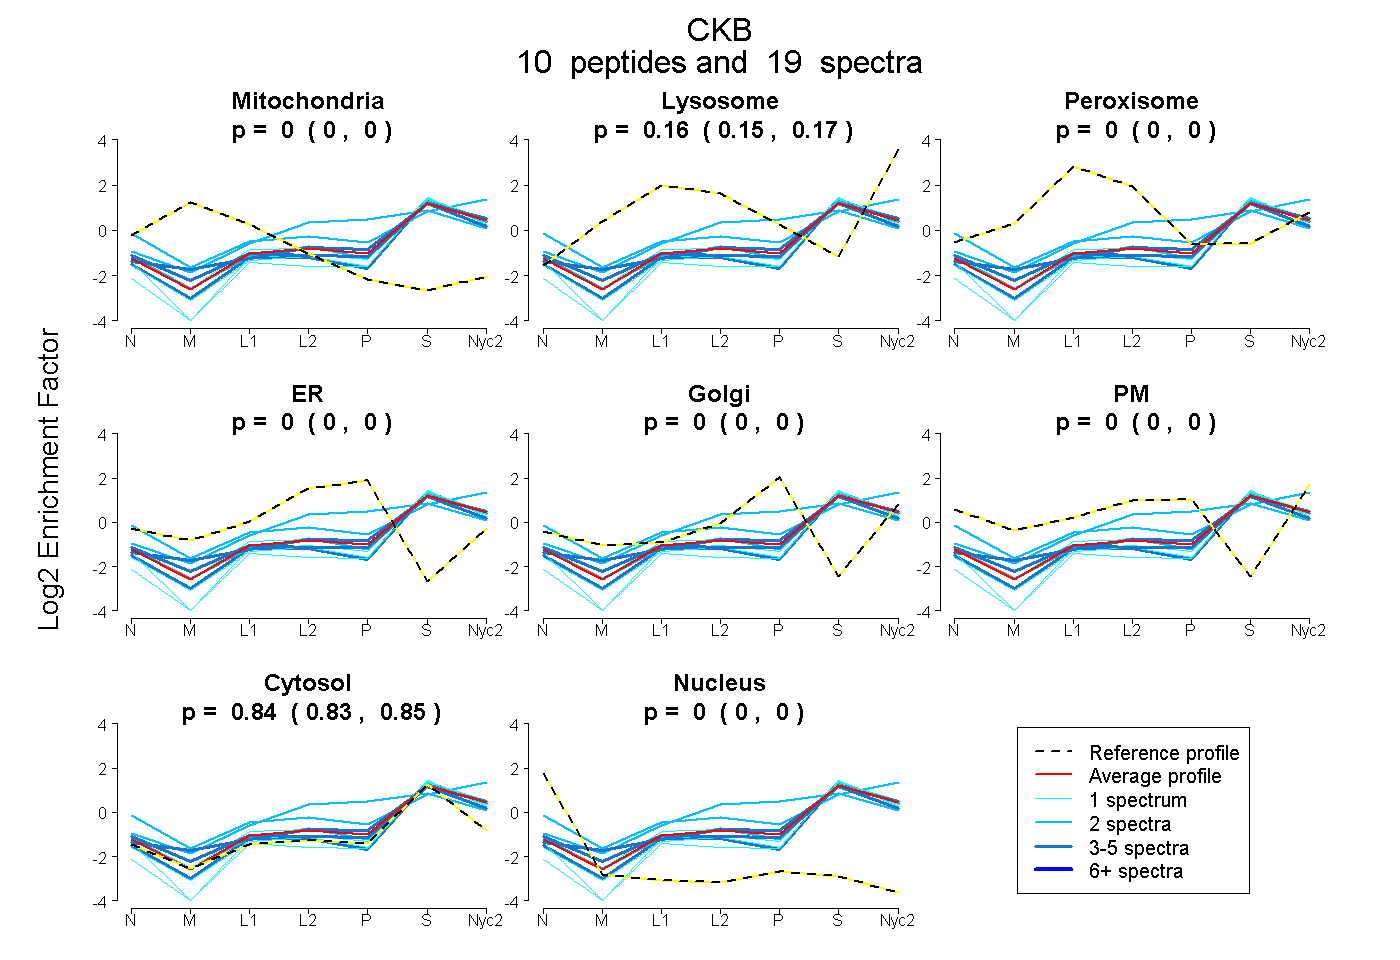
0.000 | 0.000
0.148 | 0.165
0.000 | 0.000
0.000 | 0.000
0.000 | 0.000
0.000 | 0.000
0.834 | 0.851
0.000 | 0.000
5peptides
spectra
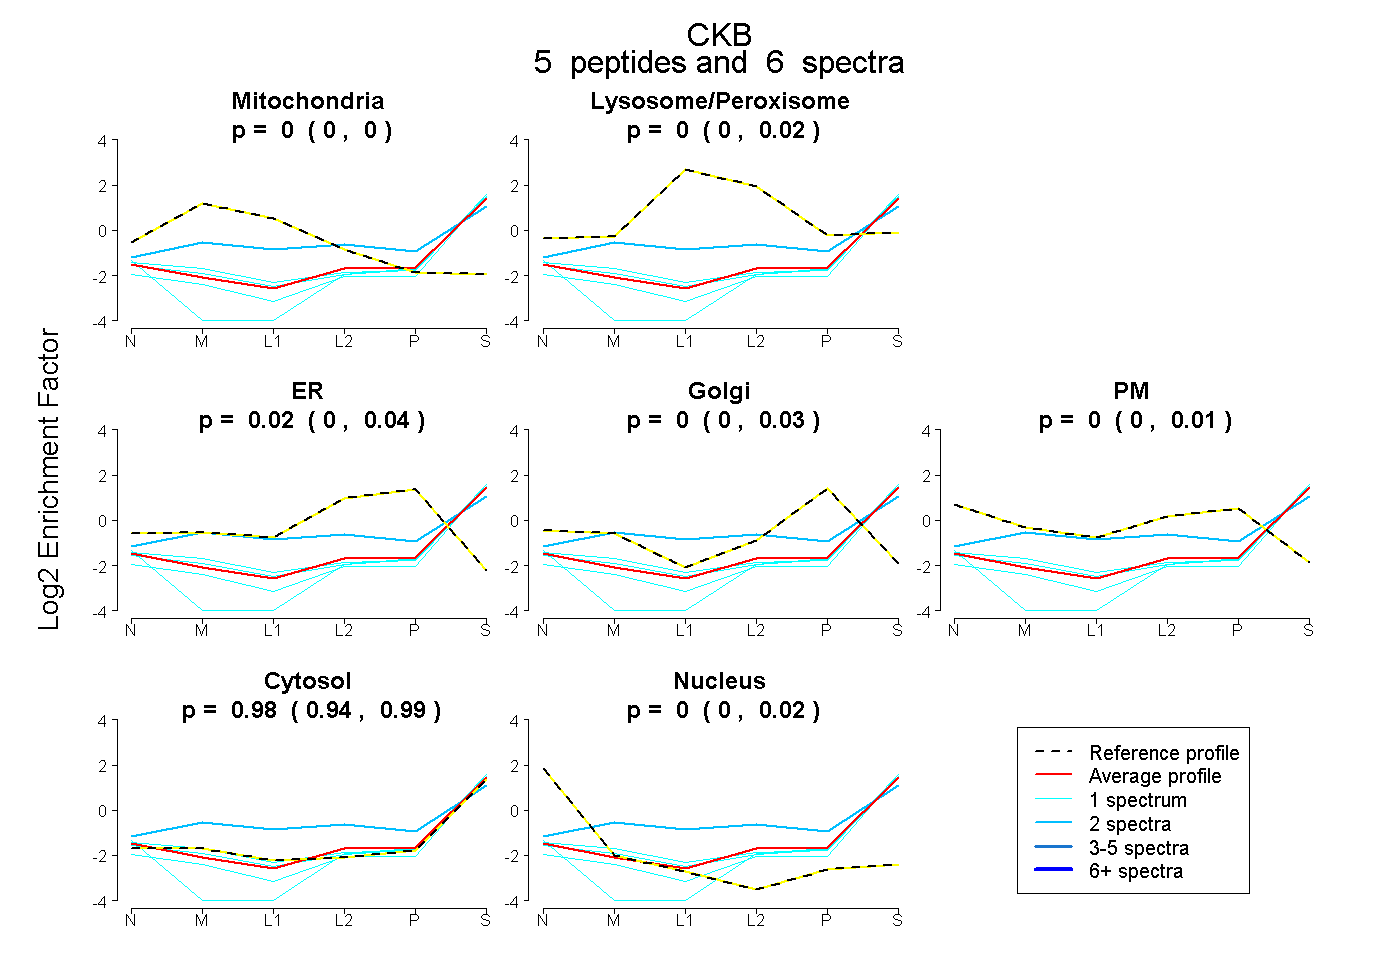
0.000 | 0.000
0.000 | 0.024
0.000 | 0.038
0.000 | 0.032
0.000 | 0.011
0.942 | 0.991
0.000 | 0.021
9peptides
spectra
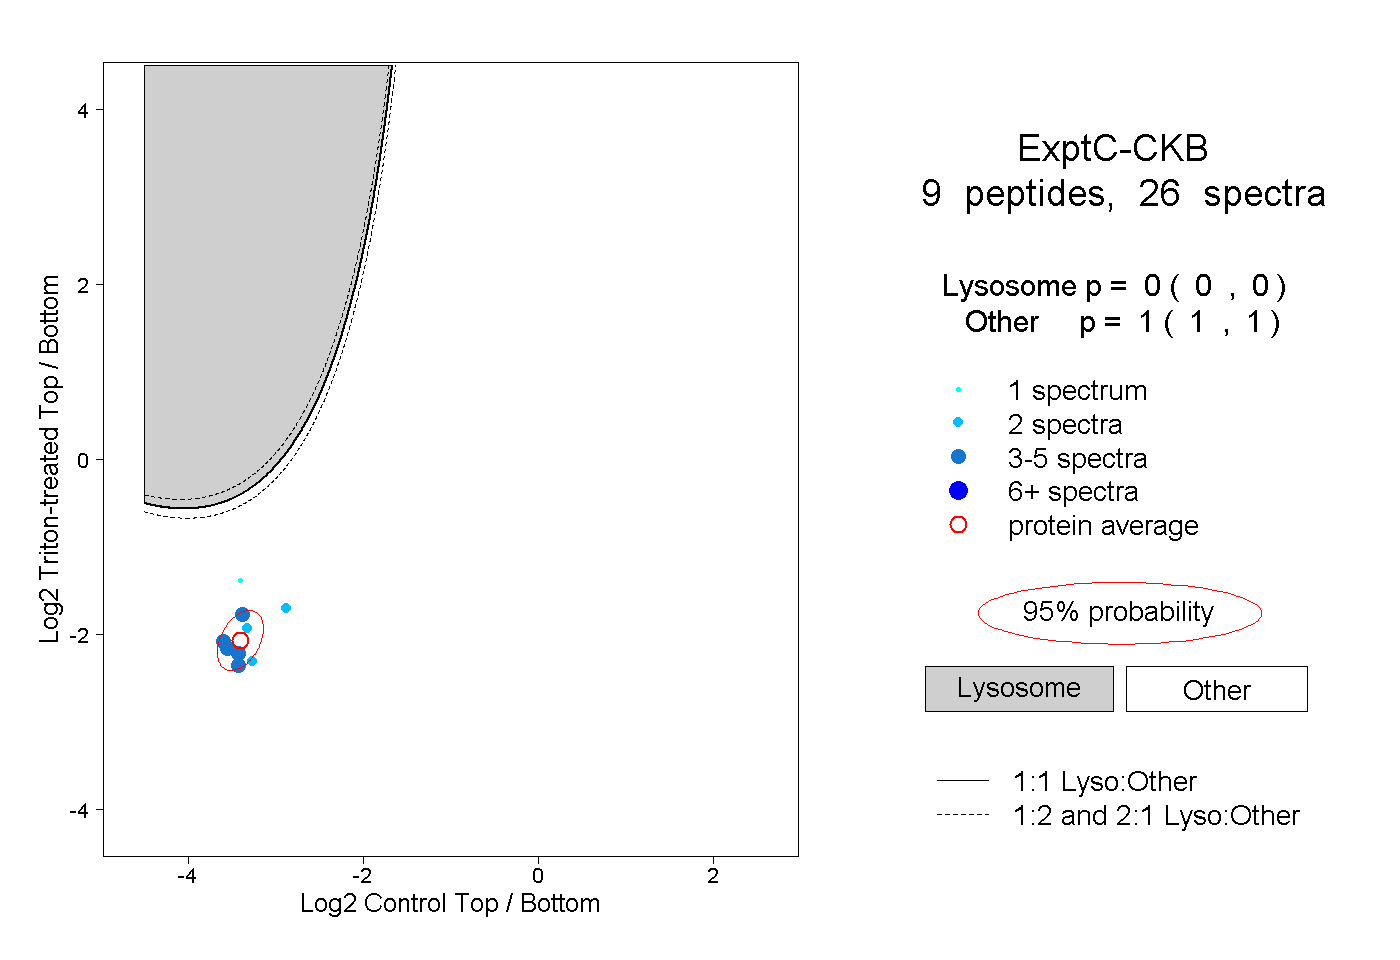
0.000 | 0.000
1.000 | 1.000
4peptides
spectra
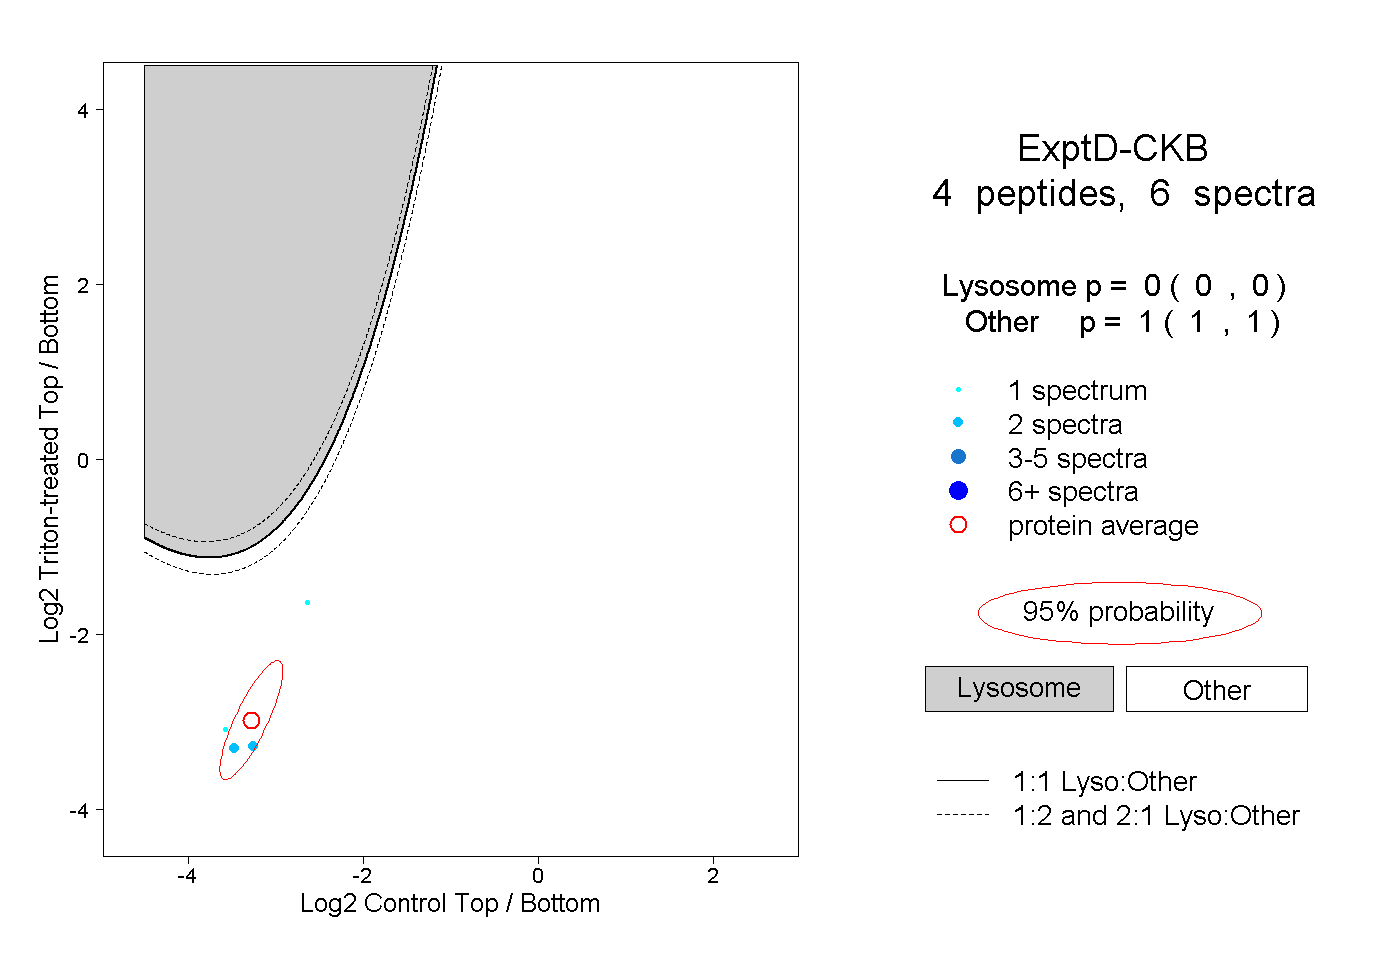
0.000 | 0.000
1.000 | 1.000