 10
10peptides
spectra
0.004 | 0.027
0.000 | 0.000
0.000 | 0.000
0.000 | 0.000
0.000 | 0.000
0.803 | 0.825
0.000 | 0.006
0.159 | 0.174
10peptides
spectra
0.000 | 0.000
1.000 | 1.000
| Plot | Mito | Lyso | Perox | ER | Golgi | PM | Cytosol | Nucleus | |||||
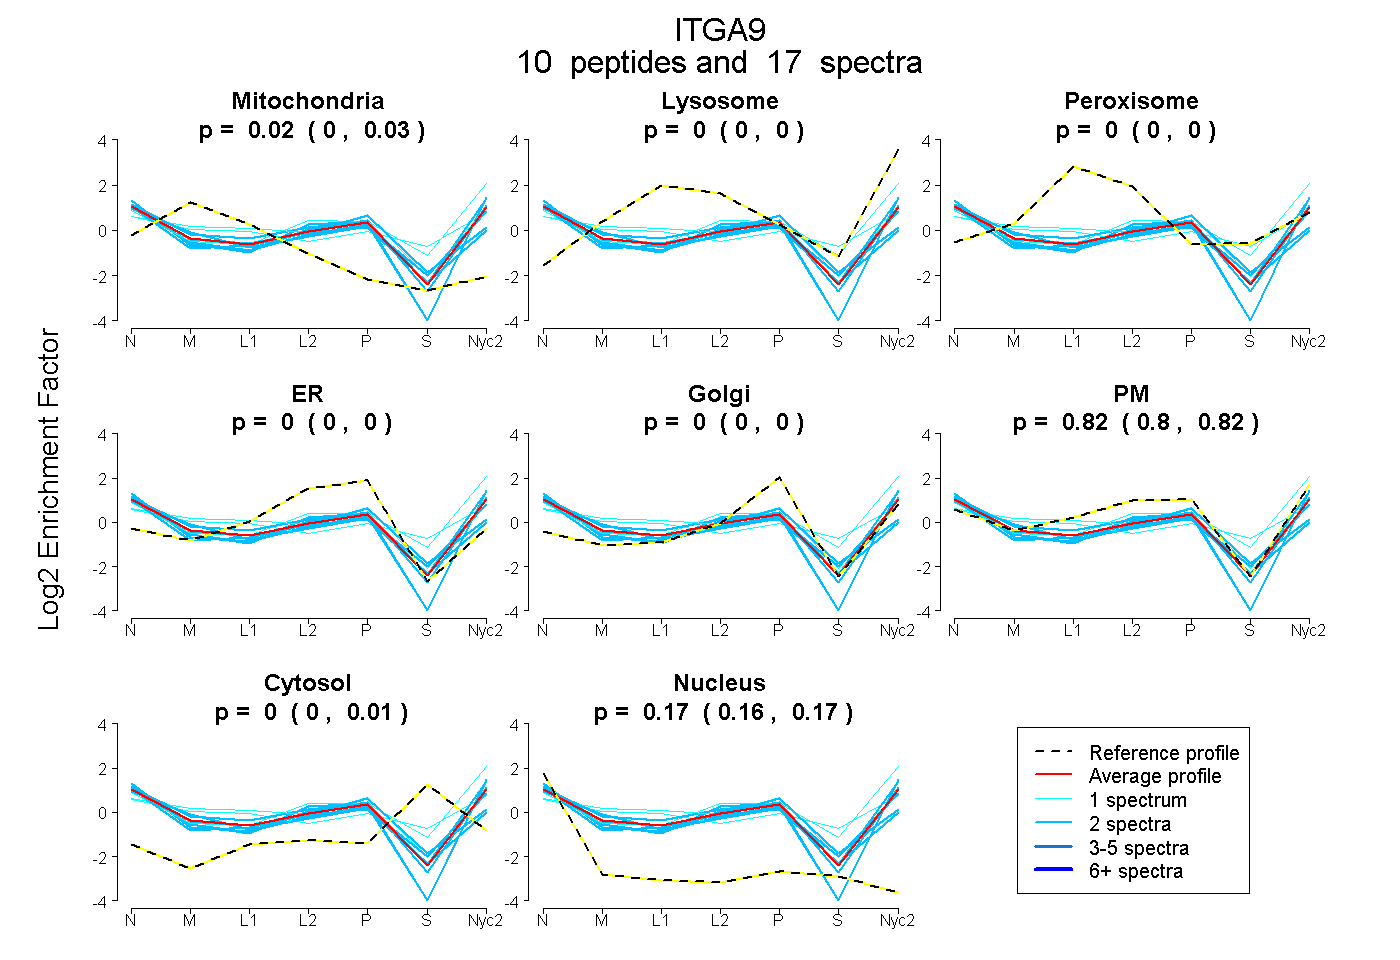
| Expt A |
10 peptides |
17 spectra |
|
0.017 0.004 | 0.027 |
0.000 0.000 | 0.000 |
0.000 0.000 | 0.000 |
0.000 0.000 | 0.000 |
0.000 0.000 | 0.000 |
0.815 0.803 | 0.825 |
0.000 0.000 | 0.006 |
0.168 0.159 | 0.174 |
||
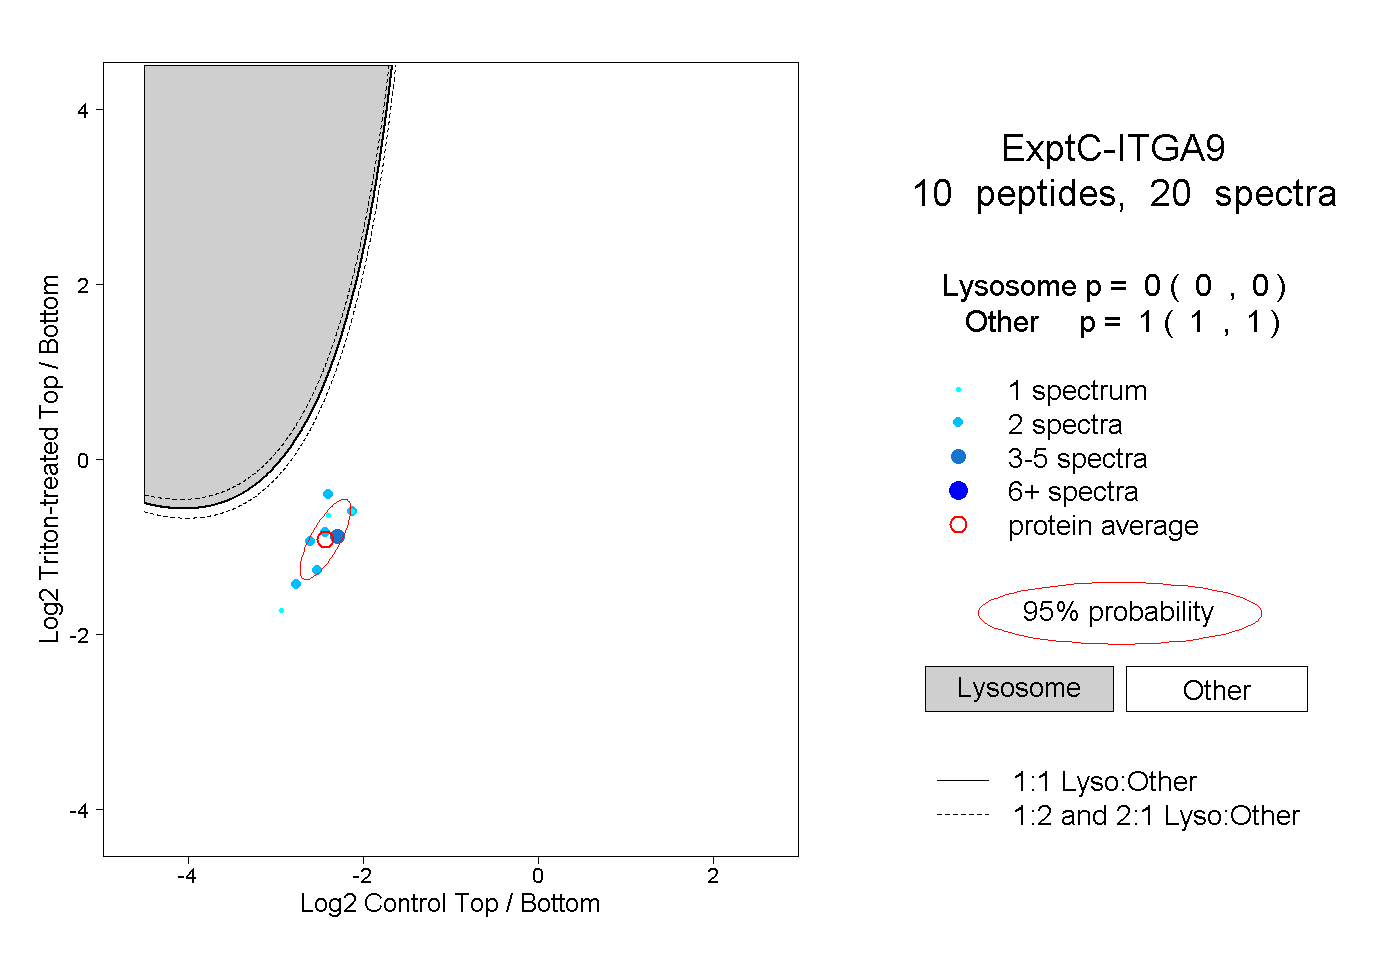
| Plot | Lyso | Other | |||||||||||
| Expt C |
10 peptides |
20 spectra |
|
0.000 0.000 | 0.000 |
1.000 1.000 | 1.000 |