 1
1peptide
spectra
0.000 | 0.000
0.125 | 0.417
0.000 | 0.119
0.000 | 0.208
0.000 | 0.302
0.016 | 0.290
0.217 | 0.397
0.000 | 0.000
1peptide
spectra
0.000 | 0.001
0.999 | 1.000
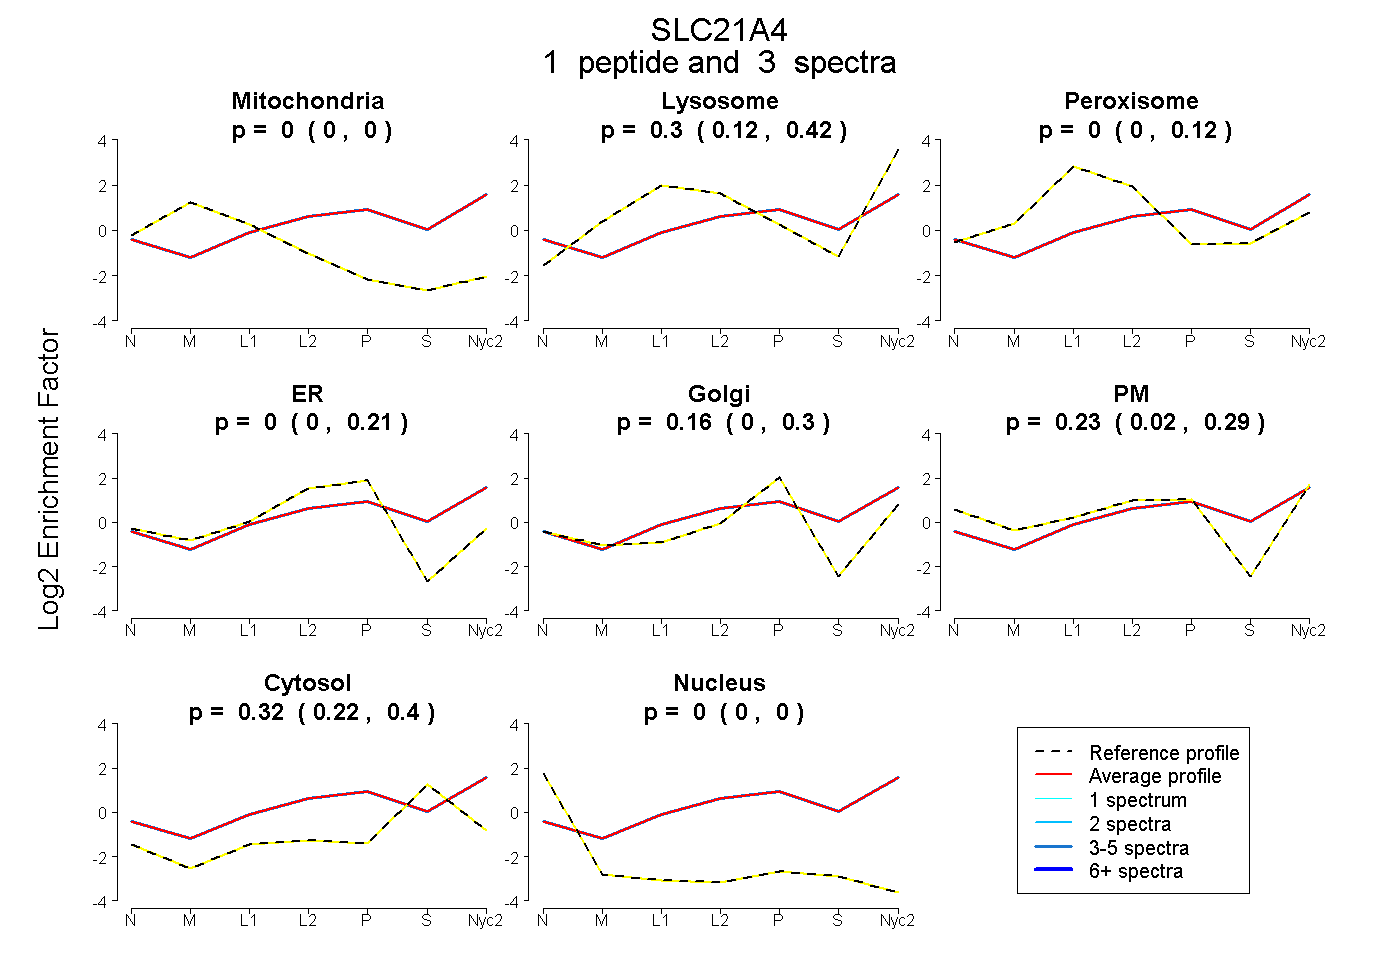
| Plot | Mito | Lyso | Perox | ER | Golgi | PM | Cytosol | Nucleus | |||||
| Expt A |
1 peptide |
3 spectra |
|
0.000 0.000 | 0.000 |
0.299 0.125 | 0.417 |
0.000 0.000 | 0.119 |
0.000 0.000 | 0.208 |
0.156 0.000 | 0.302 |
0.225 0.016 | 0.290 |
0.319 0.217 | 0.397 |
0.000 0.000 | 0.000 |
||
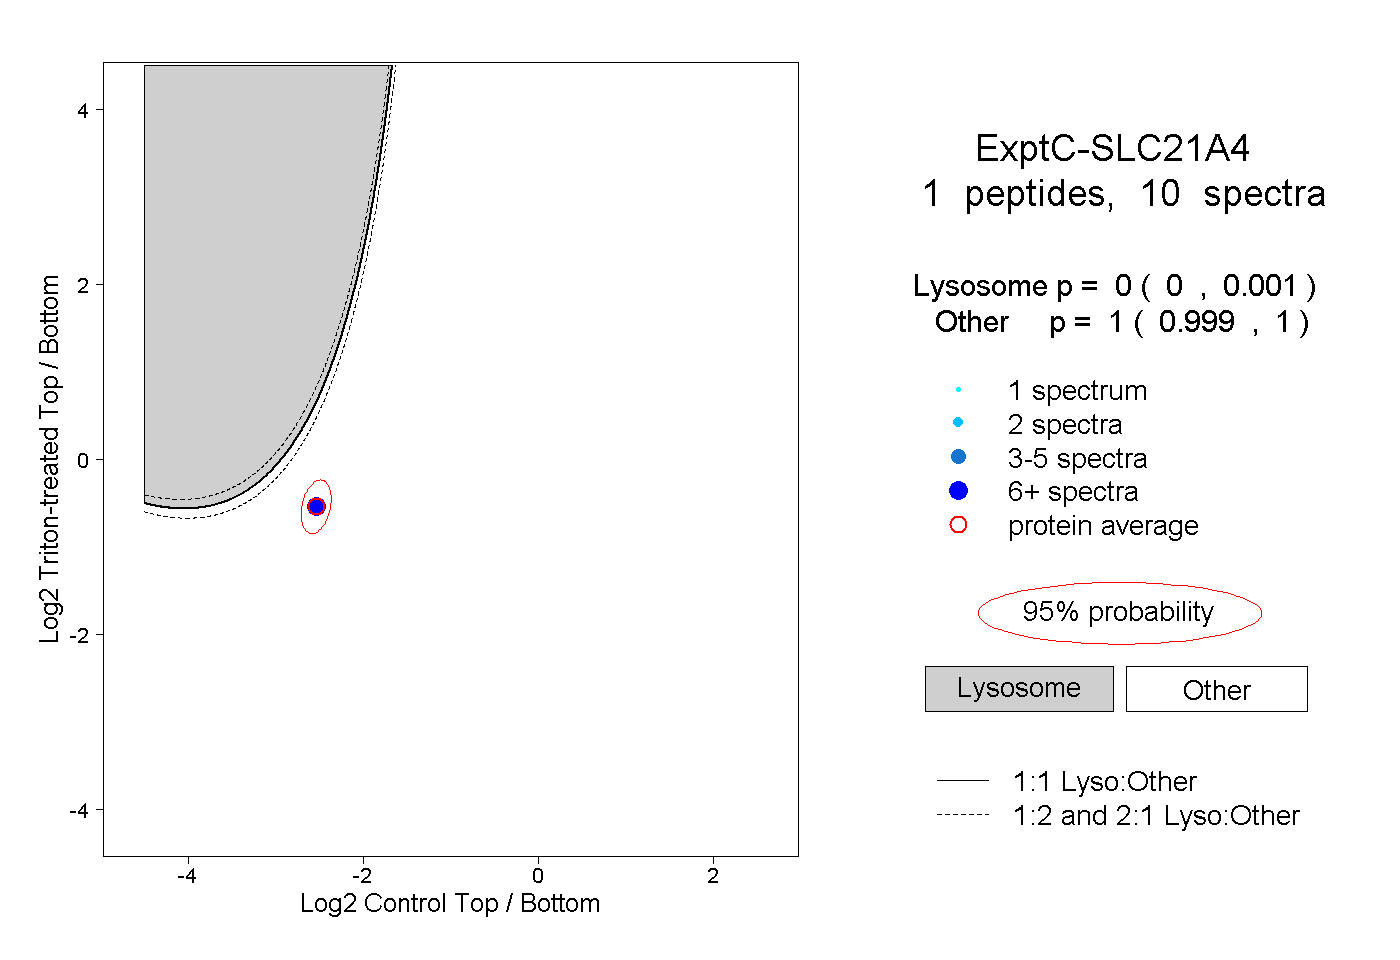
| Plot | Lyso | Other | |||||||||||
| Expt C |
1 peptide |
10 spectra |
|
0.000 0.000 | 0.001 |
1.000 0.999 | 1.000 |