 1
1peptide
spectra
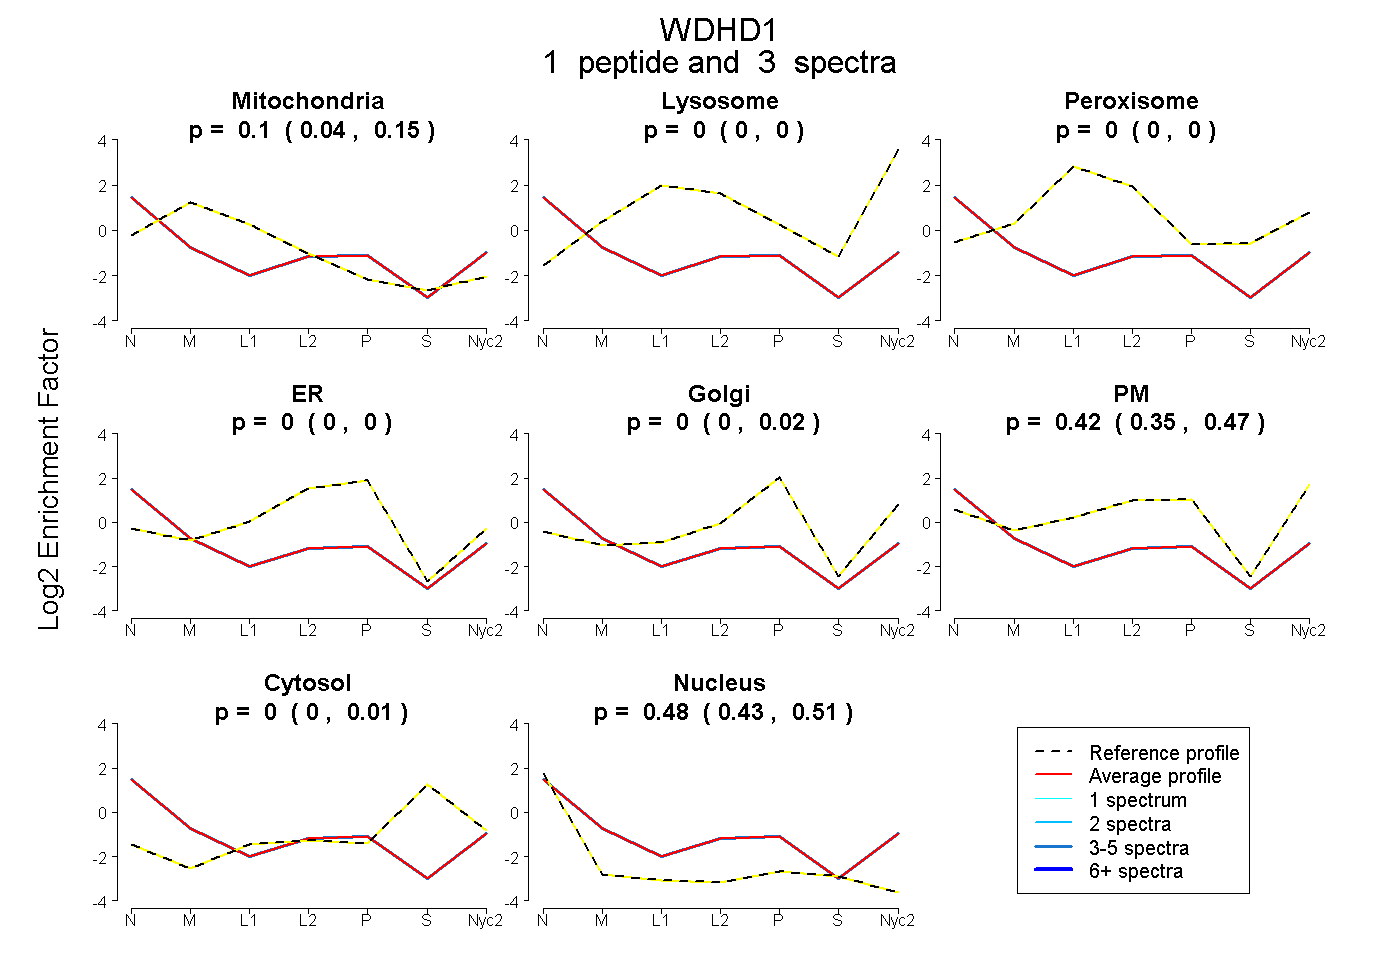
0.043 | 0.153
0.000 | 0.000
0.000 | 0.000
0.000 | 0.000
0.000 | 0.023
0.348 | 0.469
0.000 | 0.007
0.435 | 0.508
| Plot | Mito | Lyso | Perox | ER | Golgi | PM | Cytosol | Nucleus | |||||
| Expt A |
1 peptide |
3 spectra |
|
0.099 0.043 | 0.153 |
0.000 0.000 | 0.000 |
0.000 0.000 | 0.000 |
0.000 0.000 | 0.000 |
0.000 0.000 | 0.023 |
0.423 0.348 | 0.469 |
0.000 0.000 | 0.007 |
0.478 0.435 | 0.508 |