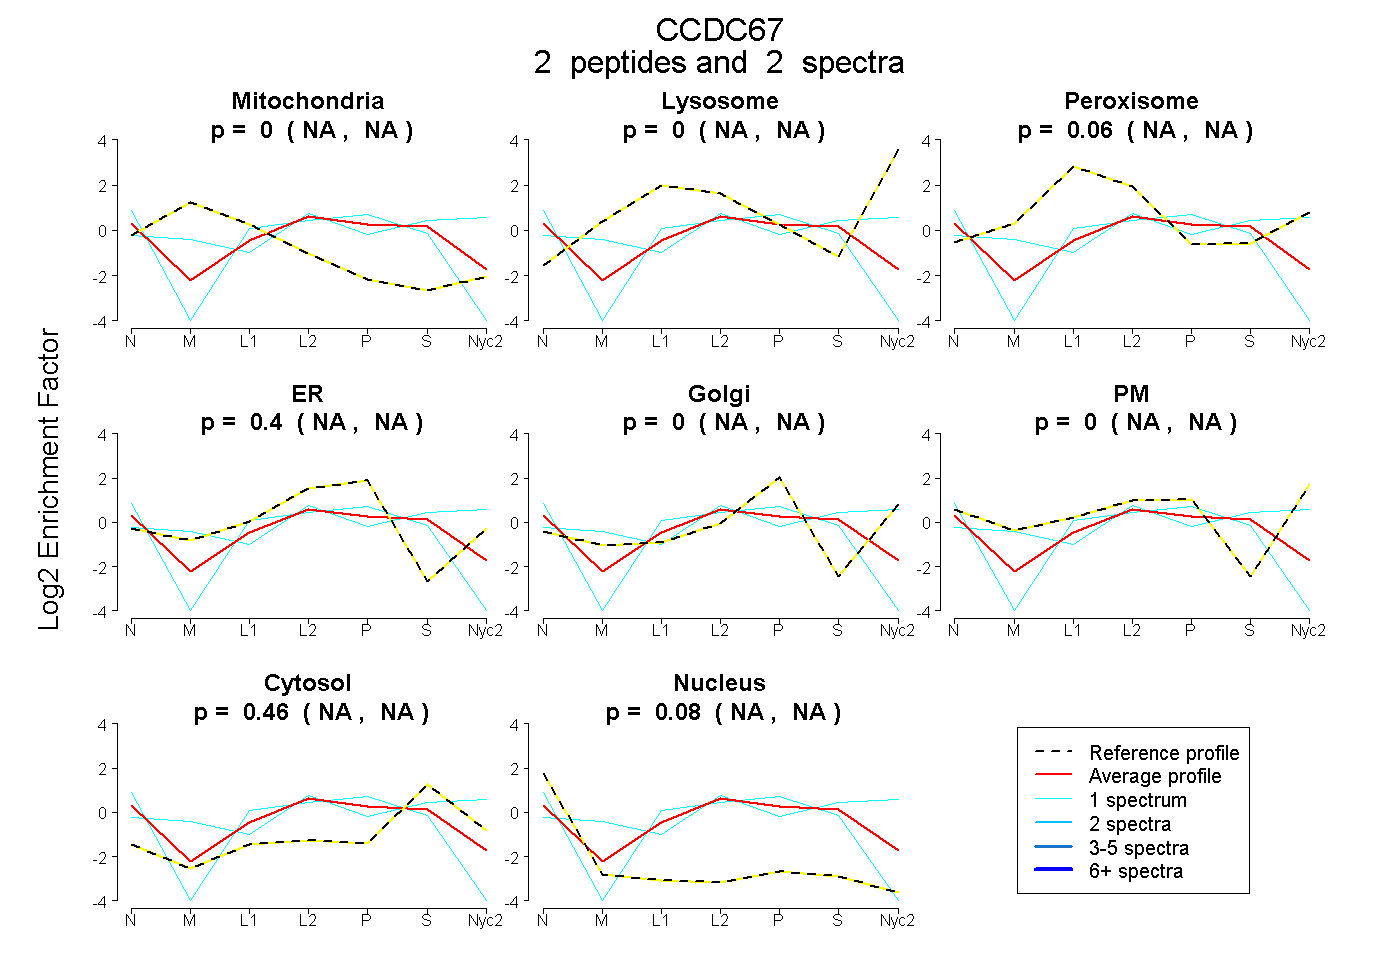
 2
2peptides
spectra
NA | NA
NA | NA
NA | NA
NA | NA
NA | NA
NA | NA
NA | NA
NA | NA
| Plot | Mito | Lyso | Perox | ER | Golgi | PM | Cytosol | Nucleus | |||||
| Expt A |
2 peptides |
2 spectra |
|
0.000 NA | NA |
0.000 NA | NA |
0.063 NA | NA |
0.395 NA | NA |
0.000 NA | NA |
0.000 NA | NA |
0.461 NA | NA |
0.081 NA | NA |
| 1 spectrum, LLNTHIDELQR | 0.000 | 0.058 | 0.117 | 0.000 | 0.000 | 0.358 | 0.467 | 0.000 | ||
| 1 spectrum, CNLVMTQNYEGQLQTLK | 0.000 | 0.000 | 0.000 | 0.400 | 0.000 | 0.000 | 0.330 | 0.270 |
| Plot | Lyso | Other | |||||||||||
| Expt C |
1 peptide |
1 spectrum |
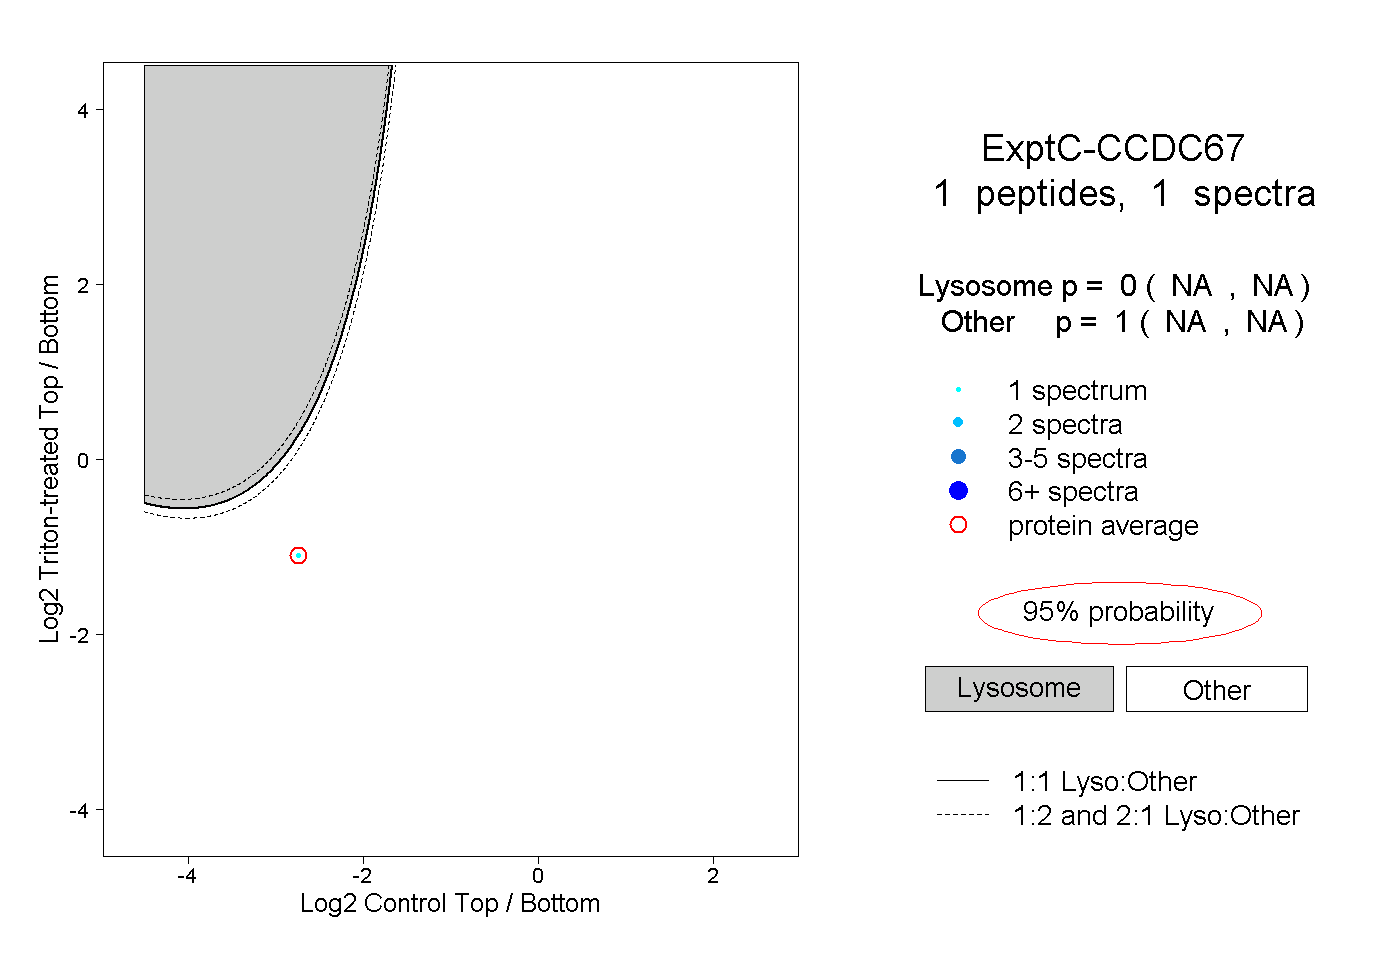 |
0.000 NA | NA |
1.000 NA | NA |