14
14peptides
spectra
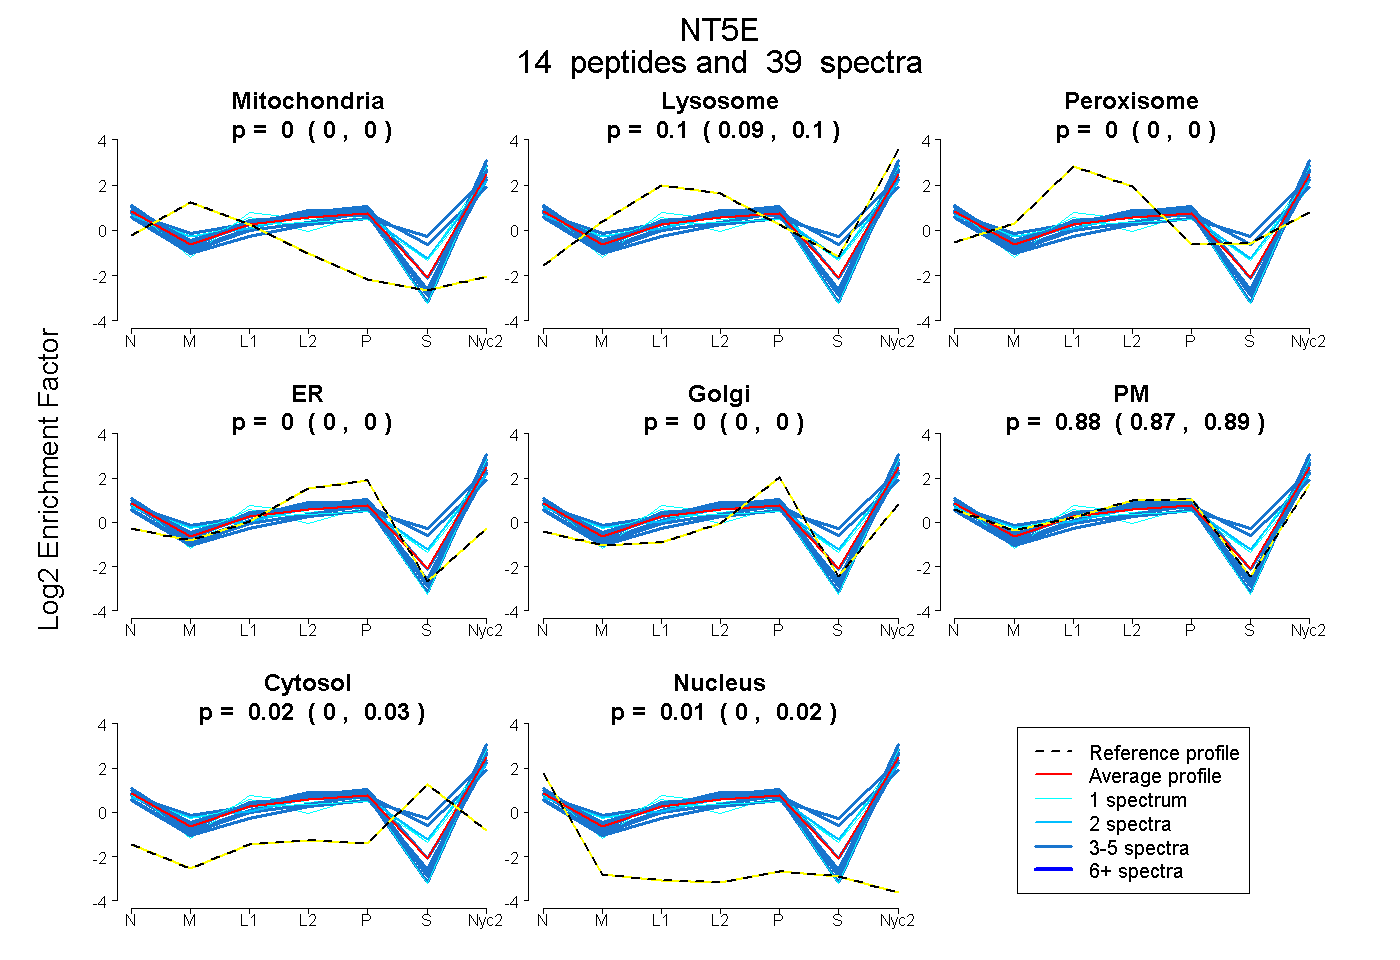
0.000 | 0.000
0.085 | 0.105
0.000 | 0.000
0.000 | 0.000
0.000 | 0.000
0.871 | 0.887
0.000 | 0.030
0.000 | 0.018
7peptides
spectra
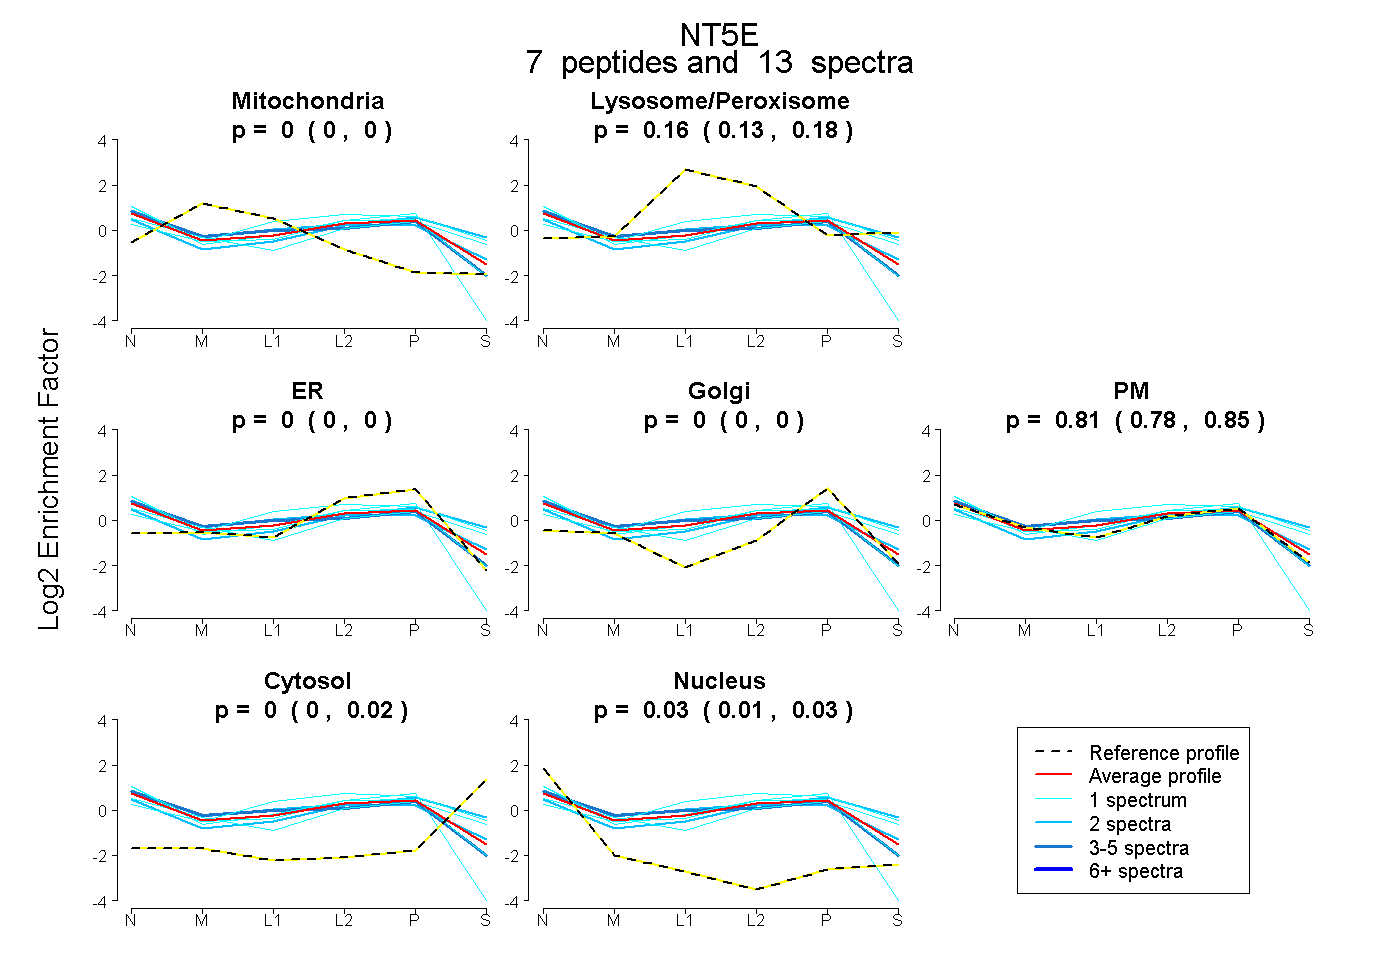
0.000 | 0.000
0.129 | 0.180
0.000 | 0.000
0.000 | 0.000
0.778 | 0.845
0.000 | 0.024
0.008 | 0.033