 14
14peptides
spectra
0.000 | 0.000
0.085 | 0.105
0.000 | 0.000
0.000 | 0.000
0.000 | 0.000
0.871 | 0.887
0.000 | 0.030
0.000 | 0.018
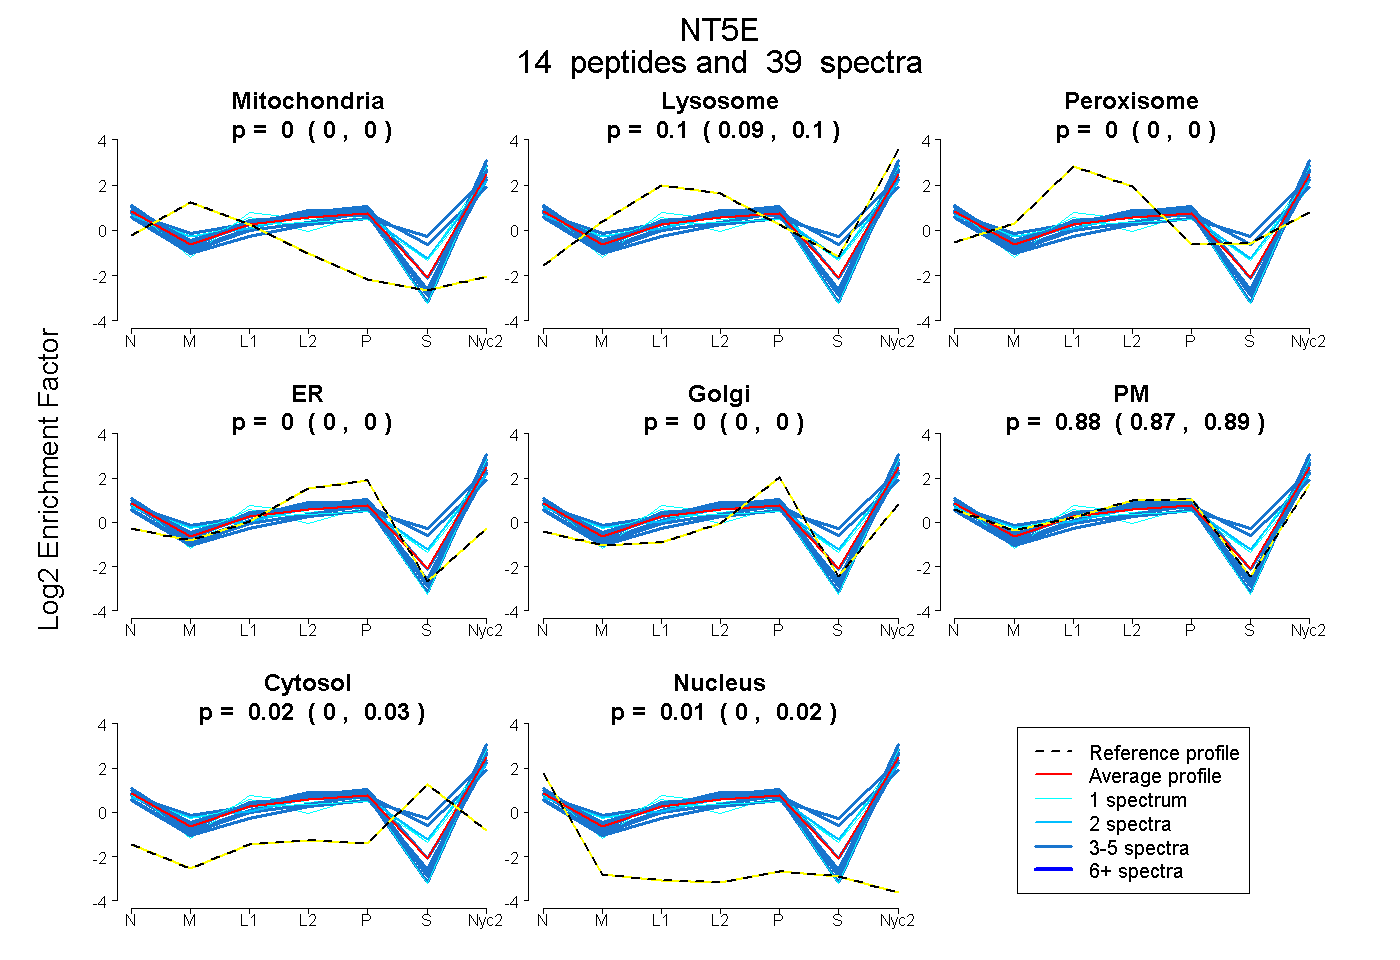
| Plot | Mito | Lyso | Perox | ER | Golgi | PM | Cytosol | Nucleus | |||||
| Expt A |
14 peptides |
39 spectra |
|
0.000 0.000 | 0.000 |
0.095 0.085 | 0.105 |
0.000 0.000 | 0.000 |
0.000 0.000 | 0.000 |
0.000 0.000 | 0.000 |
0.880 0.871 | 0.887 |
0.016 0.000 | 0.030 |
0.008 0.000 | 0.018 |
| 2 spectra, LEQTSDDSTK | 0.000 | 0.154 | 0.000 | 0.000 | 0.000 | 0.731 | 0.115 | 0.000 | ||
| 4 spectra, VIYPAVEGR | 0.000 | 0.001 | 0.000 | 0.000 | 0.000 | 0.999 | 0.000 | 0.000 | ||
| 3 spectra, HDSGDQDISVVSEYISK | 0.000 | 0.113 | 0.000 | 0.000 | 0.000 | 0.652 | 0.235 | 0.000 | ||
| 3 spectra, YLGYIK | 0.000 | 0.054 | 0.000 | 0.000 | 0.000 | 0.946 | 0.000 | 0.000 | ||
| 1 spectrum, GPLAPQISGLYLPYK | 0.000 | 0.185 | 0.000 | 0.000 | 0.000 | 0.716 | 0.100 | 0.000 | ||
| 1 spectrum, AFEHSVHR | 0.000 | 0.027 | 0.082 | 0.000 | 0.000 | 0.773 | 0.118 | 0.000 | ||
| 3 spectra, VPIYEPLEMDK | 0.000 | 0.112 | 0.000 | 0.000 | 0.000 | 0.888 | 0.000 | 0.000 | ||
| 3 spectra, FPILSANIK | 0.000 | 0.061 | 0.000 | 0.000 | 0.000 | 0.935 | 0.000 | 0.004 | ||
| 5 spectra, IIALGHSGFEMDK | 0.000 | 0.062 | 0.000 | 0.000 | 0.000 | 0.938 | 0.000 | 0.000 | ||
| 3 spectra, VEFDDK | 0.000 | 0.182 | 0.000 | 0.000 | 0.000 | 0.547 | 0.272 | 0.000 | ||
| 1 spectrum, YGQSTGEFLQVGGIHVVYDISR | 0.000 | 0.178 | 0.000 | 0.000 | 0.000 | 0.722 | 0.101 | 0.000 | ||
| 4 spectra, YPFIVTSDDGR | 0.000 | 0.045 | 0.000 | 0.000 | 0.000 | 0.955 | 0.000 | 0.000 | ||
| 1 spectrum, VPVVQAYAFGK | 0.000 | 0.018 | 0.000 | 0.000 | 0.000 | 0.982 | 0.000 | 0.000 | ||
| 5 spectra, ADINQWR | 0.000 | 0.015 | 0.000 | 0.000 | 0.000 | 0.955 | 0.030 | 0.000 |
| Plot | Mito | Lyso or Perox | ER | Golgi | PM | Cytosol | Nucleus | ||||||
| Expt B |
7 peptides |
13 spectra |
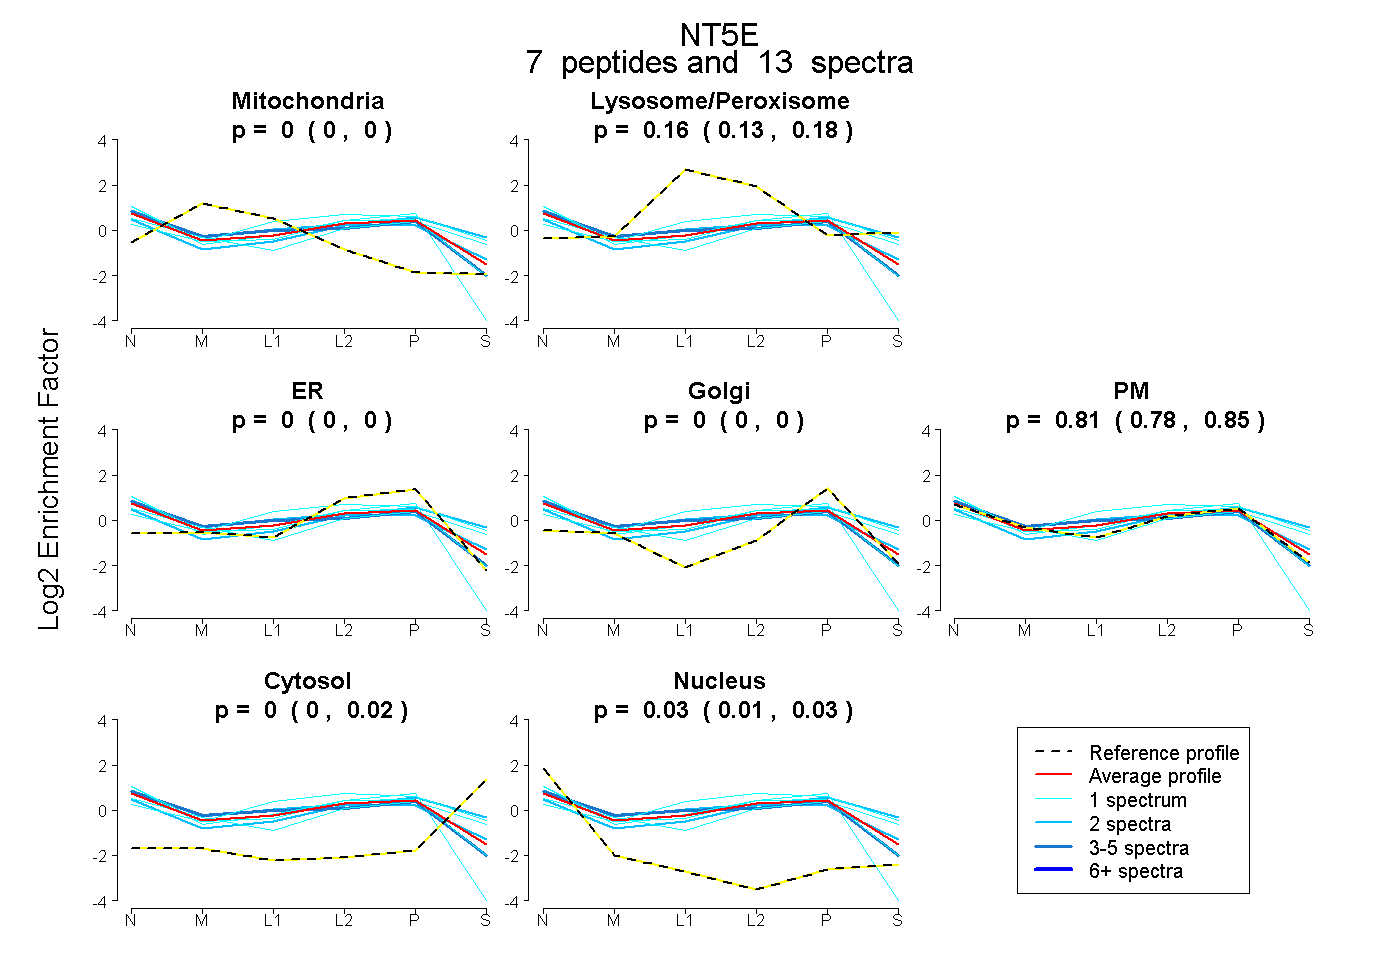 |
0.000 0.000 | 0.000 |
0.160 0.129 | 0.180 |
0.000 0.000 | 0.000 |
0.000 0.000 | 0.000 |
0.813 0.778 | 0.845 |
0.000 0.000 | 0.024 |
0.027 0.008 | 0.033 |
|||
| Plot | Lyso | Other | |||||||||||
| Expt C |
14 peptides |
132 spectra |
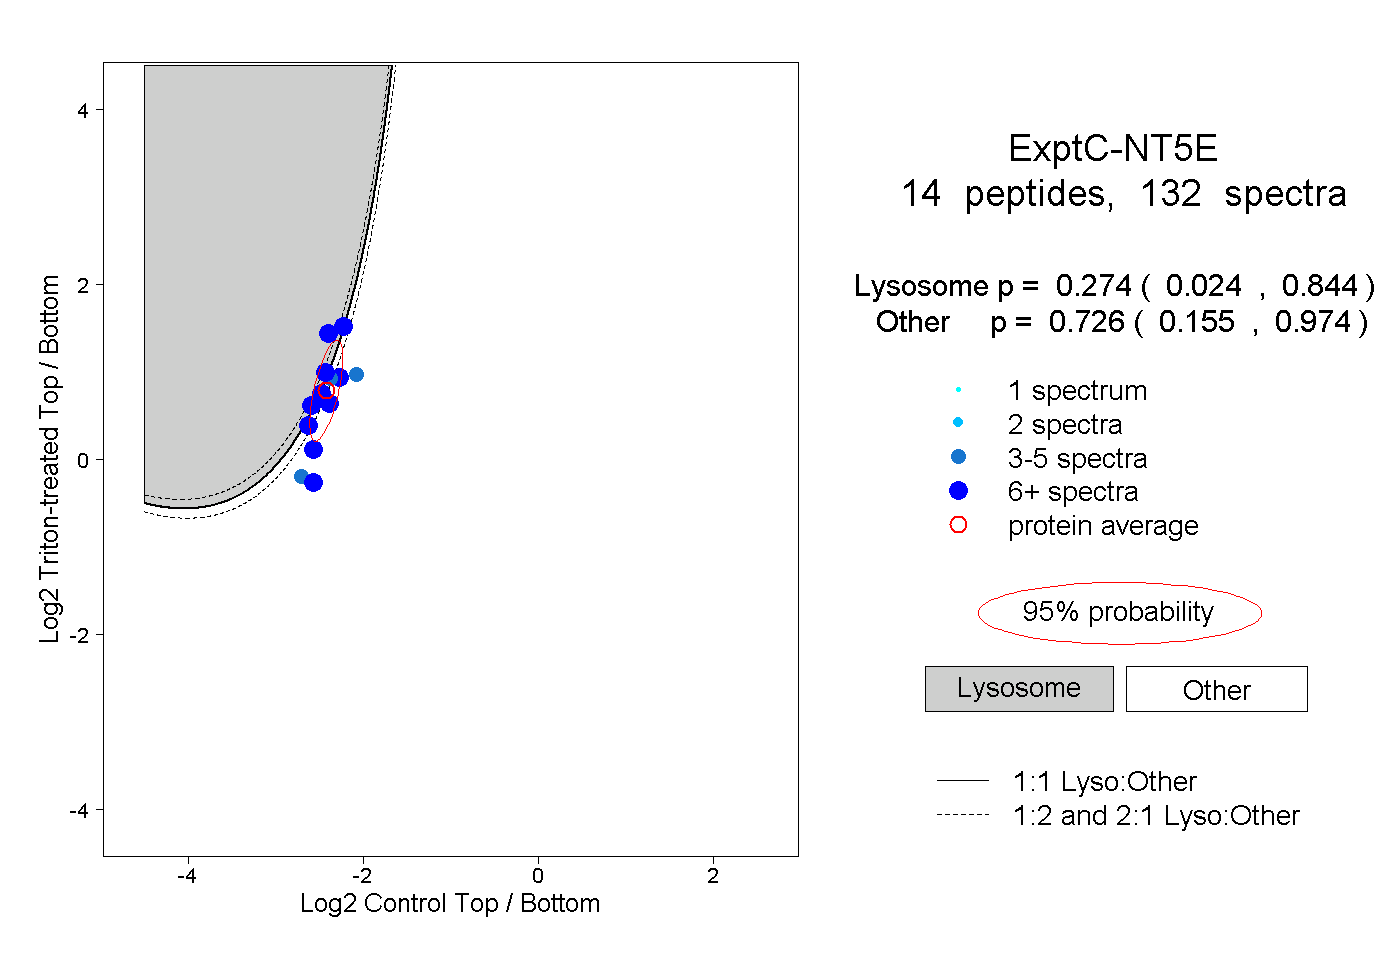 |
0.274 0.024 | 0.844 |
0.726 0.155 | 0.974 |
||||||||
| Plot | Lyso | Other | |||||||||||
| Expt D |
5 peptides |
8 spectra |
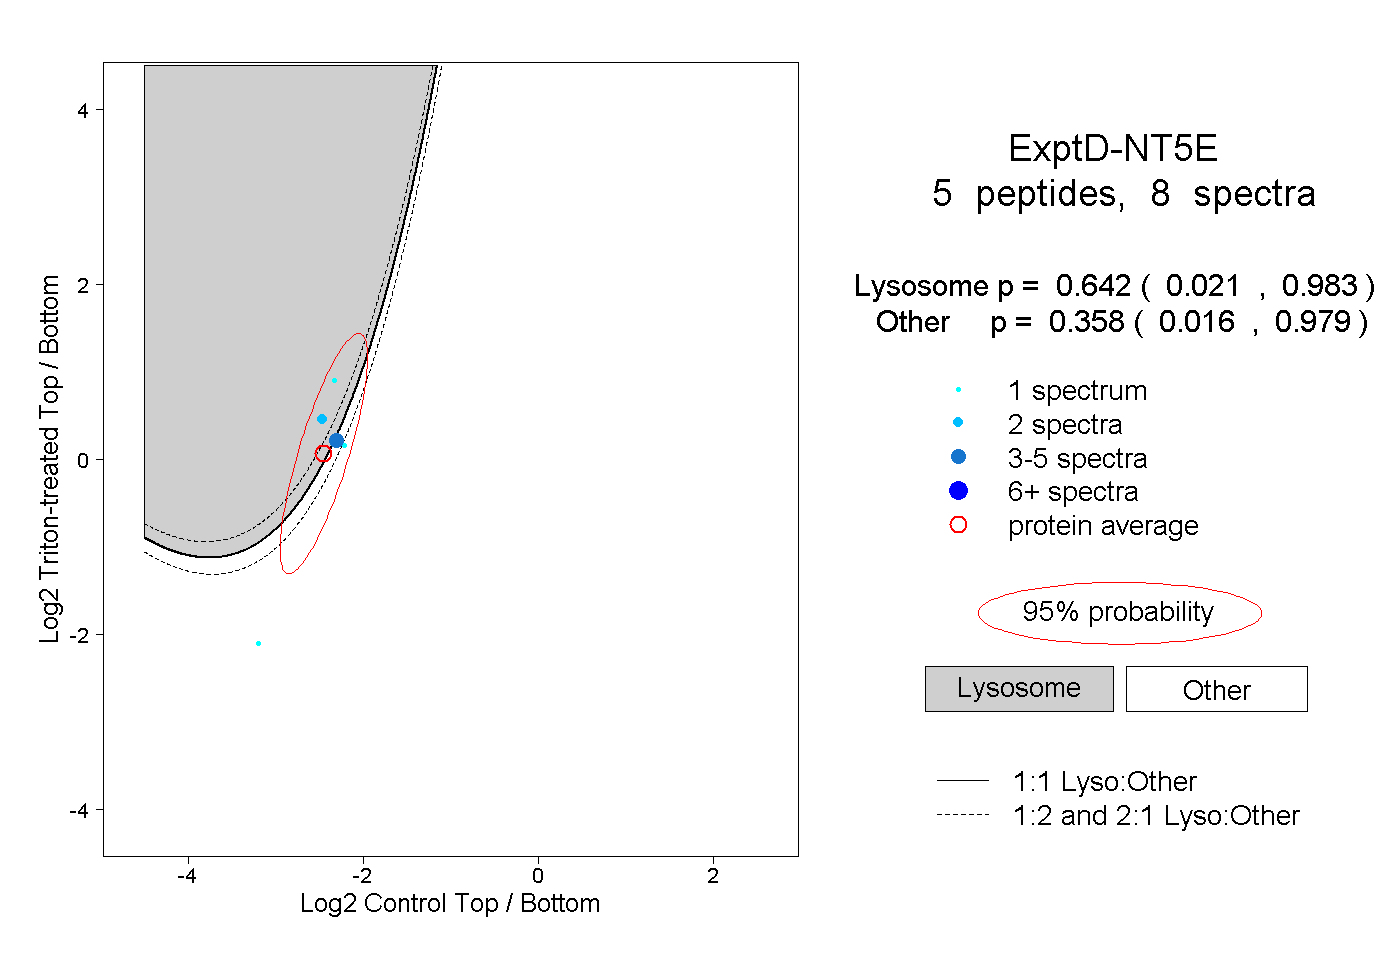 |
0.642 0.021 | 0.983 |
0.358 0.016 | 0.979 |