 2
2peptides
spectra
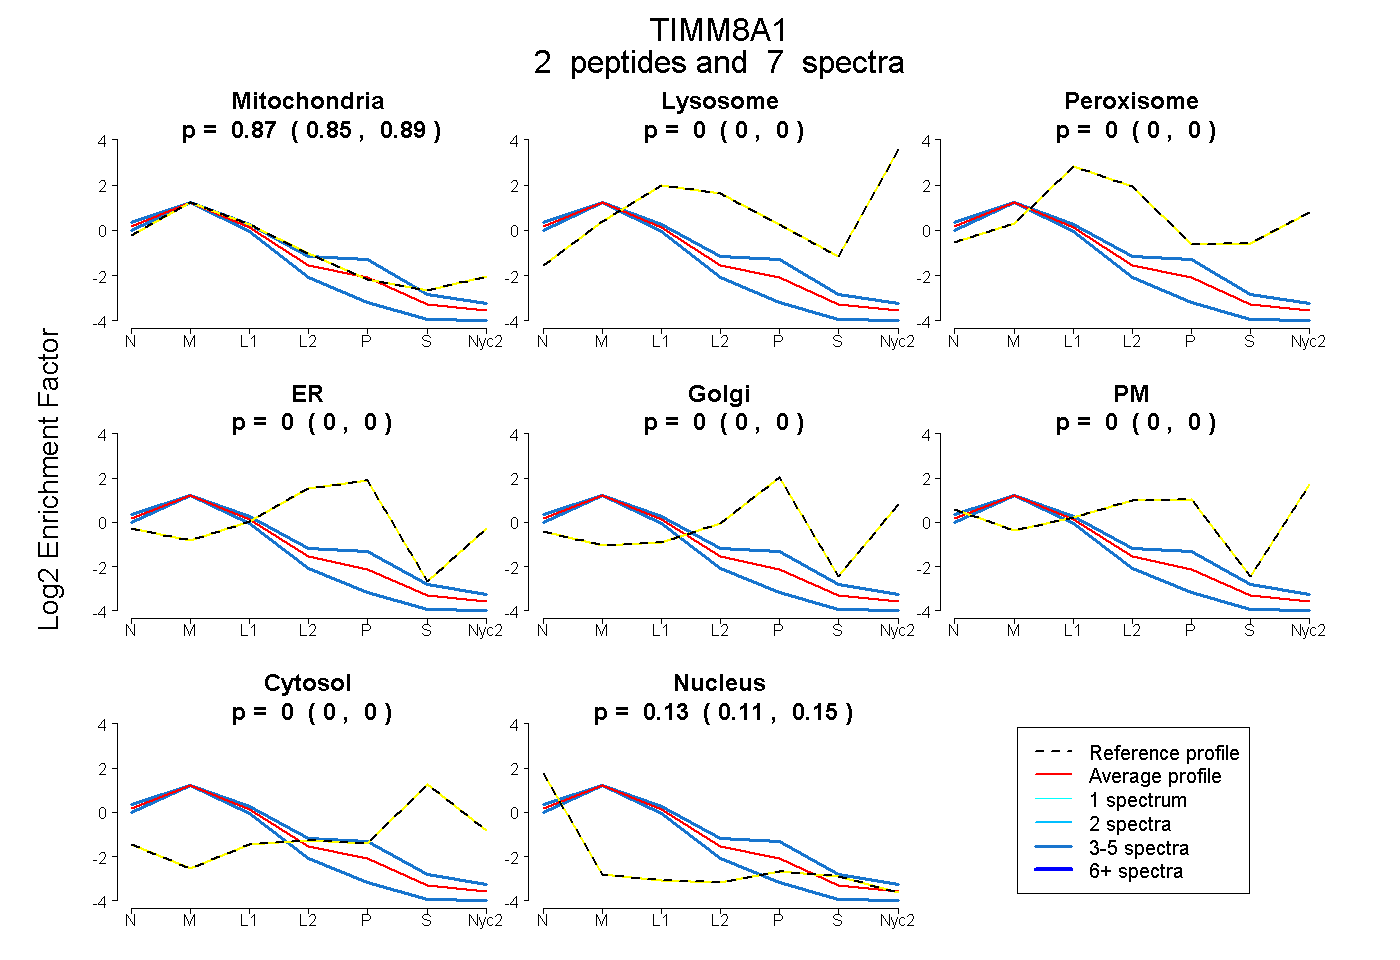
0.850 | 0.888
0.000 | 0.000
0.000 | 0.000
0.000 | 0.000
0.000 | 0.000
0.000 | 0.000
0.000 | 0.000
0.108 | 0.146
2peptides
spectra
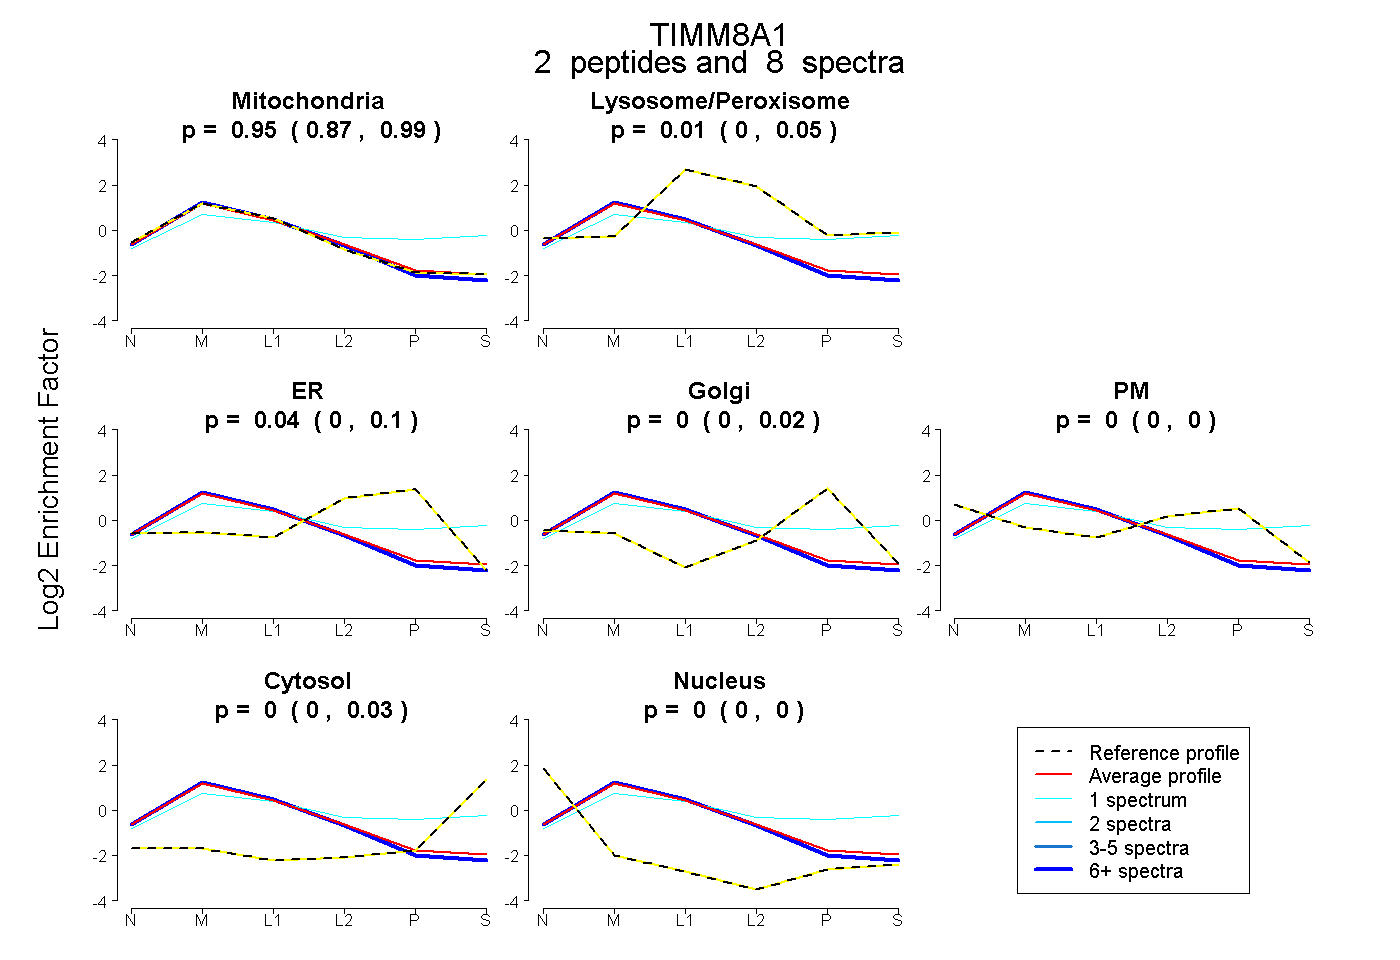
0.871 | 0.994
0.000 | 0.050
0.000 | 0.097
0.000 | 0.023
0.000 | 0.000
0.000 | 0.031
0.000 | 0.000
4peptides
spectra
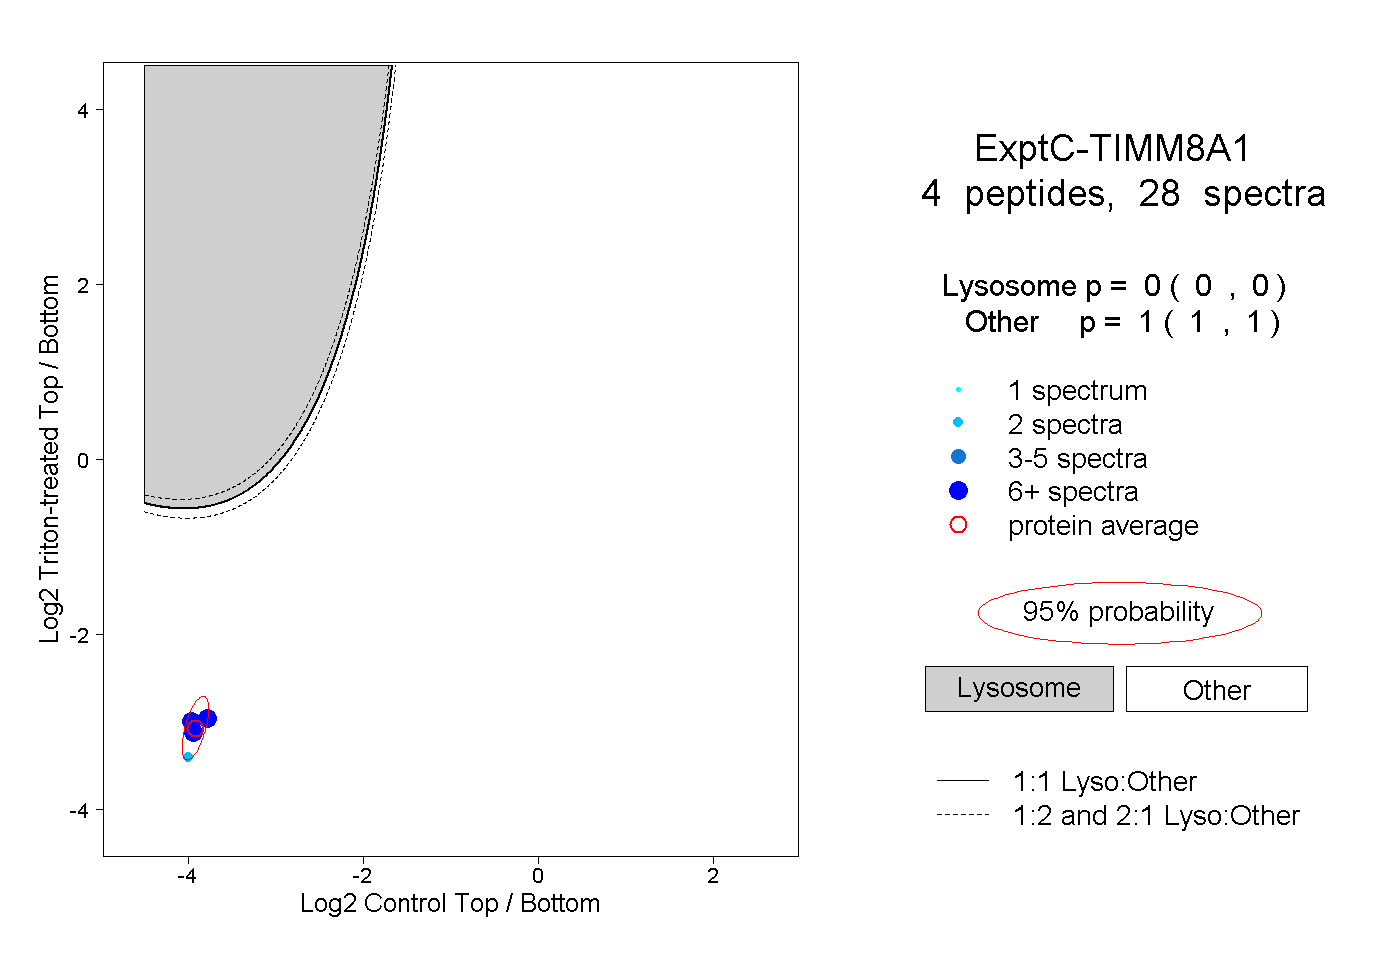
0.000 | 0.000
1.000 | 1.000
1peptide
spectra
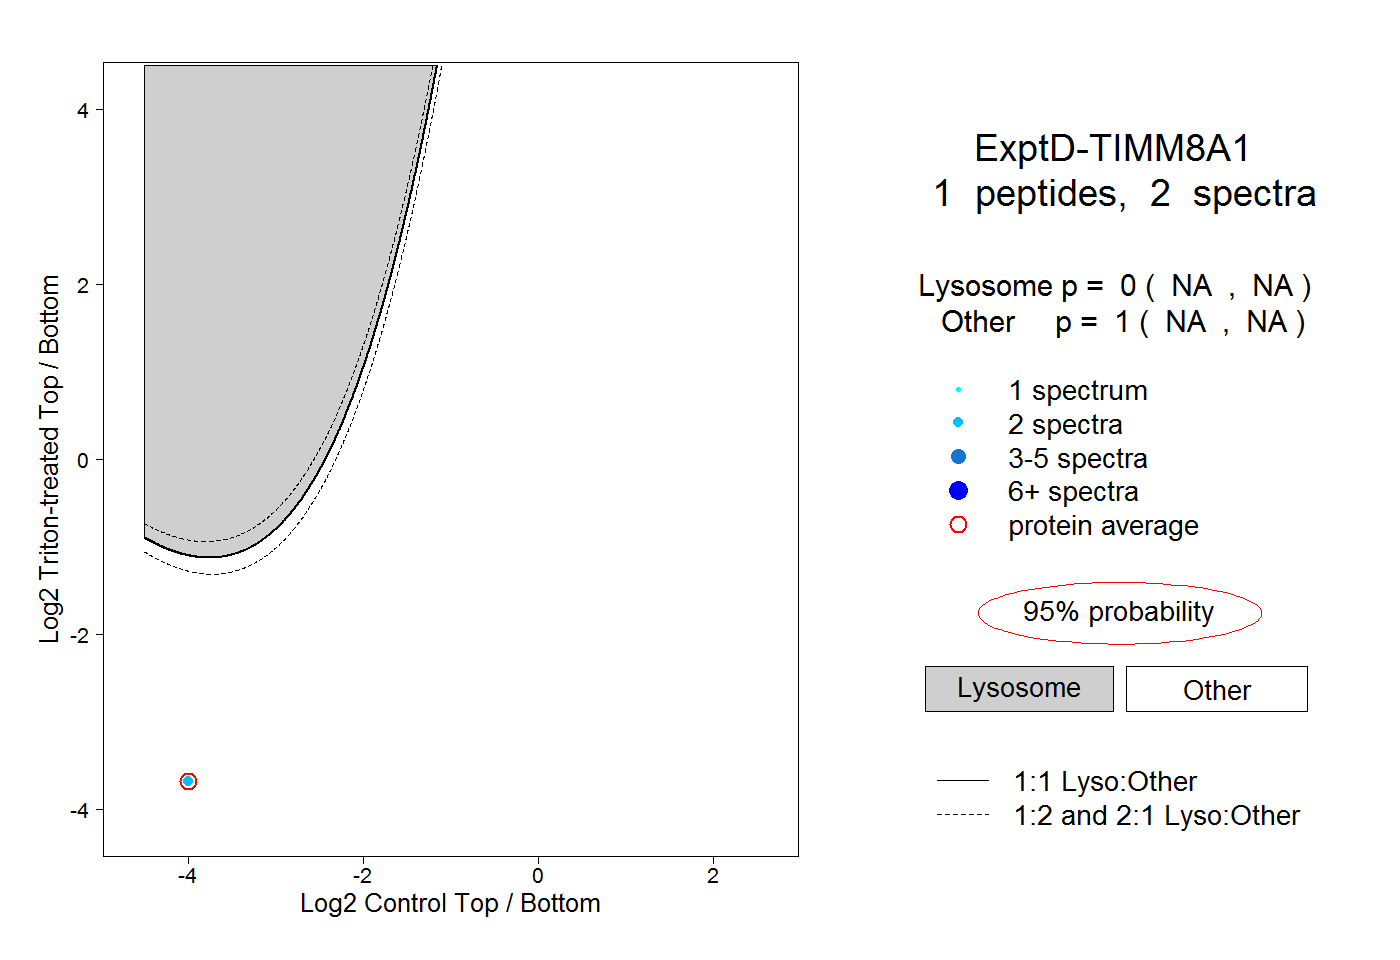
NA | NA
NA | NA