 6
6peptides
spectra
0.000 | 0.000
0.000 | 0.000
0.000 | 0.000
0.000 | 0.120
0.000 | 0.173
0.000 | 0.000
0.761 | 0.795
0.034 | 0.111
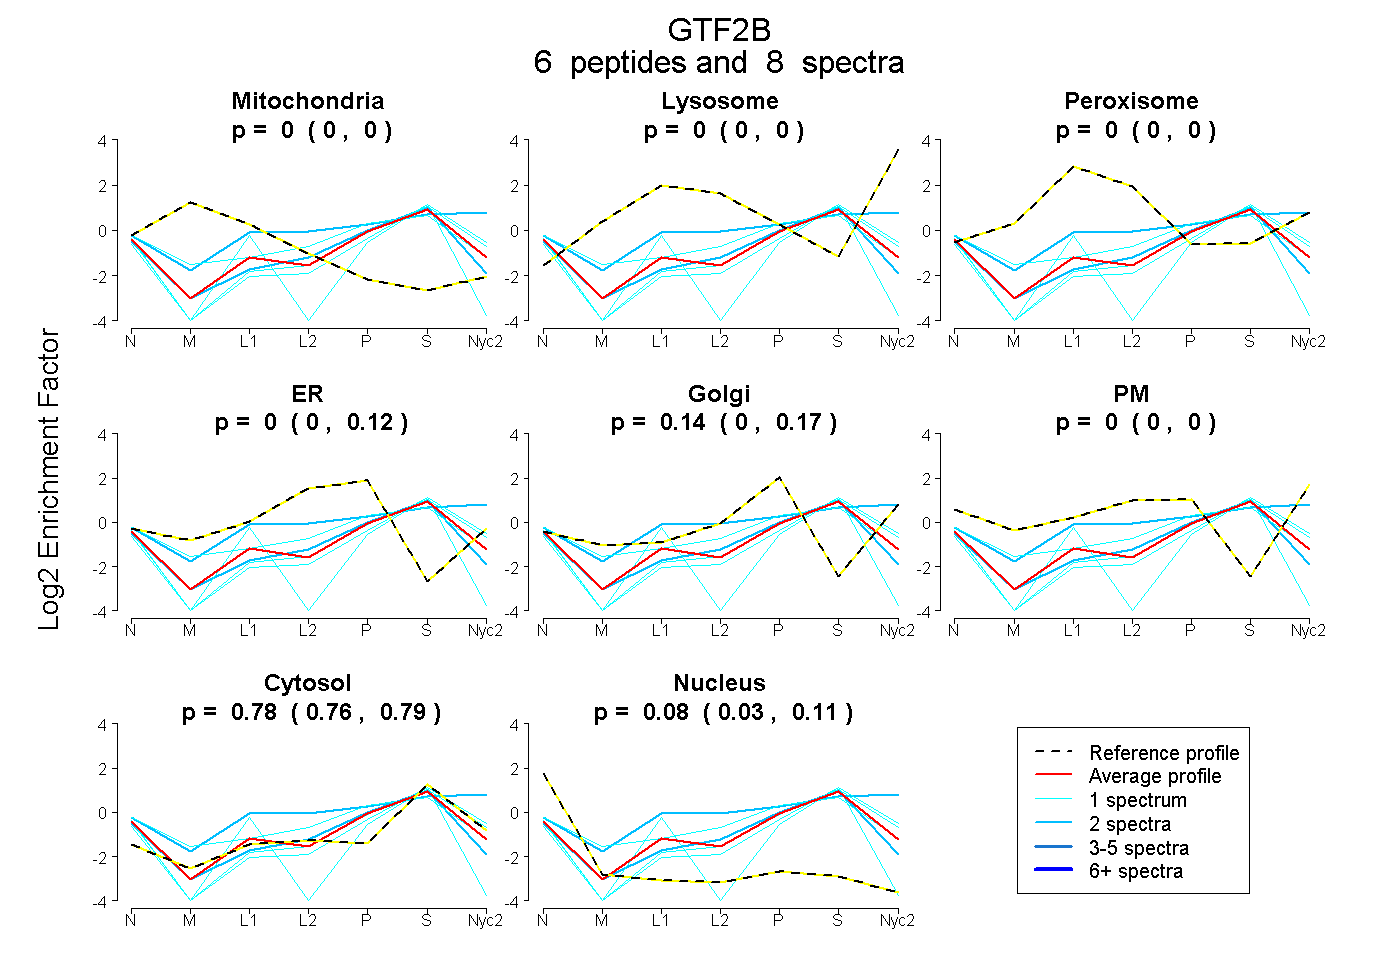
| Plot | Mito | Lyso | Perox | ER | Golgi | PM | Cytosol | Nucleus | |||||
| Expt A |
6 peptides |
8 spectra |
|
0.000 0.000 | 0.000 |
0.000 0.000 | 0.000 |
0.000 0.000 | 0.000 |
0.000 0.000 | 0.120 |
0.143 0.000 | 0.173 |
0.000 0.000 | 0.000 |
0.779 0.761 | 0.795 |
0.078 0.034 | 0.111 |
| 1 spectrum, TFSNDK | 0.000 | 0.000 | 0.000 | 0.000 | 0.103 | 0.000 | 0.826 | 0.071 | ||
| 2 spectra, QVQMAATHIAR | 0.000 | 0.129 | 0.055 | 0.000 | 0.000 | 0.281 | 0.536 | 0.000 | ||
| 1 spectrum, TNNLFK | 0.000 | 0.000 | 0.000 | 0.279 | 0.034 | 0.000 | 0.654 | 0.034 | ||
| 2 spectra, AVELDLVPGR | 0.000 | 0.000 | 0.000 | 0.103 | 0.000 | 0.000 | 0.777 | 0.120 | ||
| 1 spectrum, ANDAIASACLYIACR | 0.000 | 0.000 | 0.000 | 0.000 | 0.000 | 0.000 | 0.712 | 0.288 | ||
| 1 spectrum, VGDSQNPLLSDGDLSTMIGK | 0.000 | 0.000 | 0.000 | 0.000 | 0.000 | 0.000 | 0.875 | 0.125 |