5
5peptides
spectra
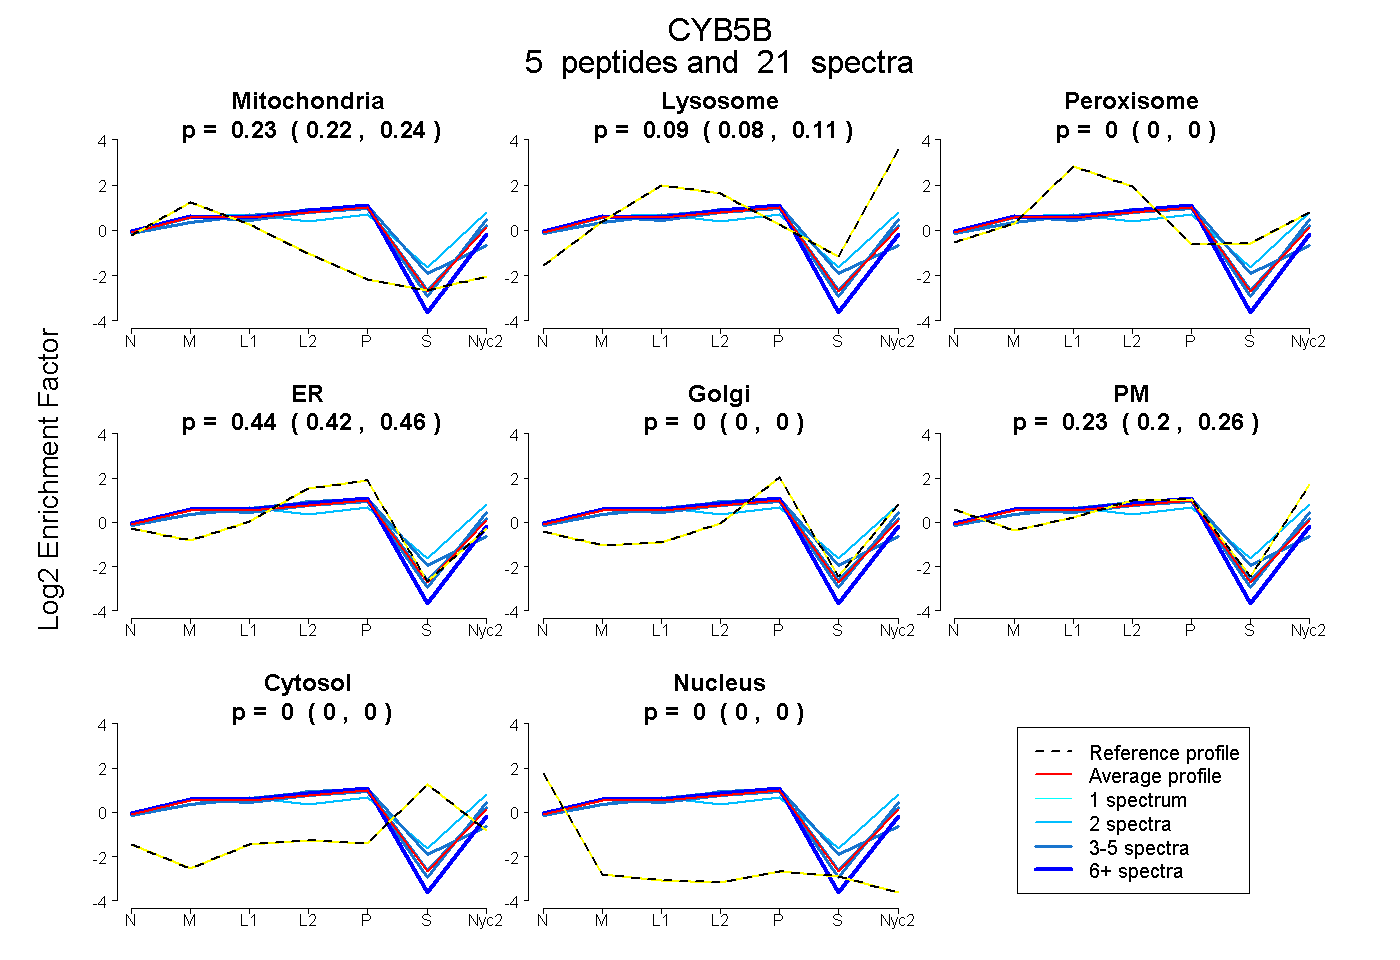
0.222 | 0.239
0.078 | 0.108
0.000 | 0.000
0.416 | 0.462
0.000 | 0.000
0.201 | 0.258
0.000 | 0.000
0.000 | 0.000
4peptides
spectra
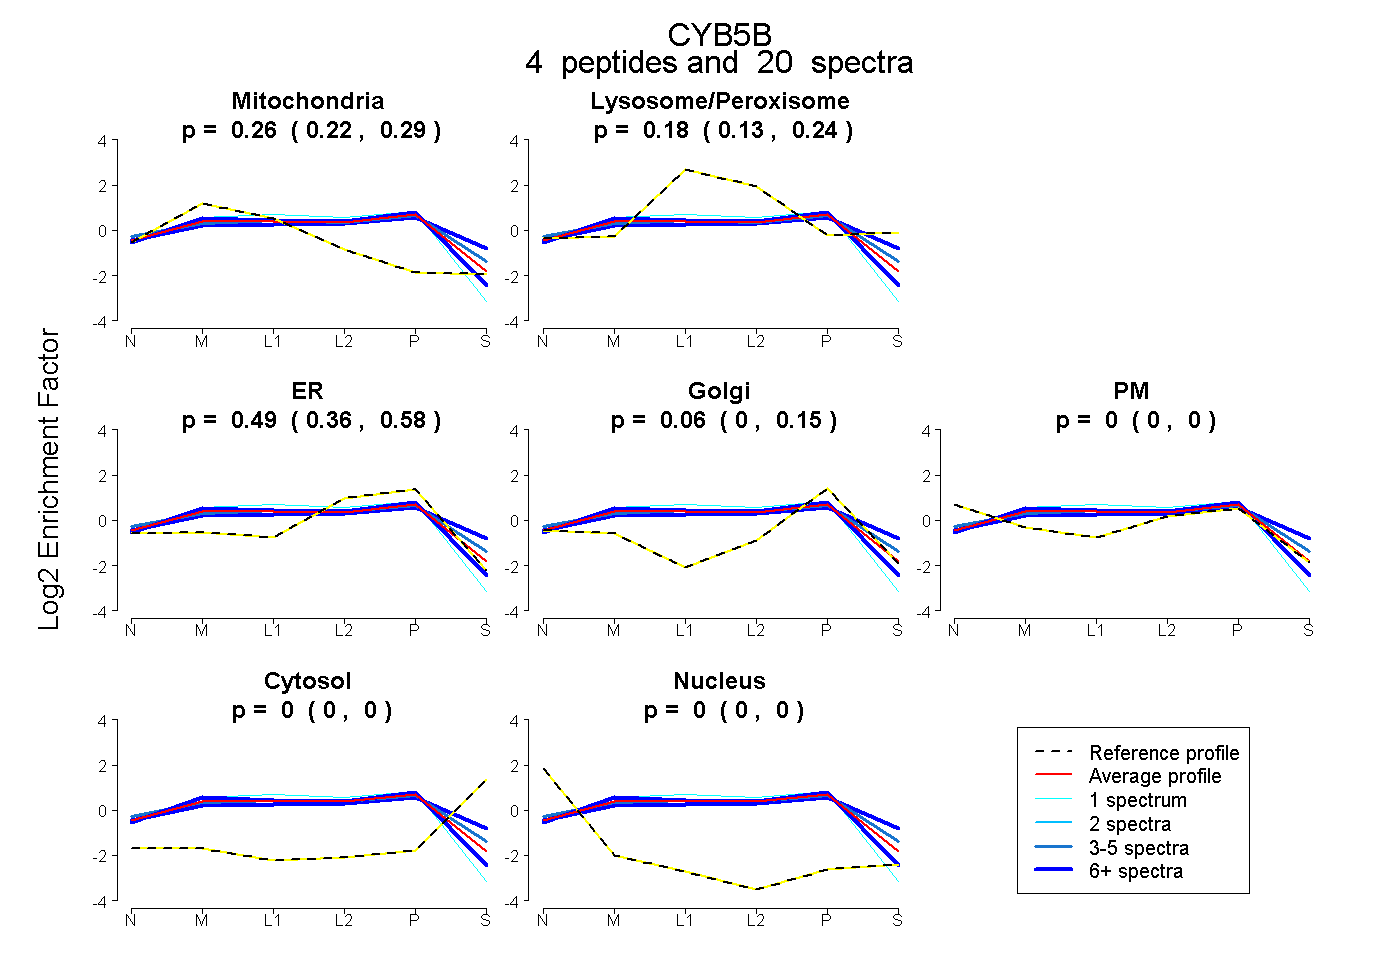
0.218 | 0.287
0.127 | 0.239
0.356 | 0.582
0.000 | 0.147
0.000 | 0.000
0.000 | 0.000
0.000 | 0.000