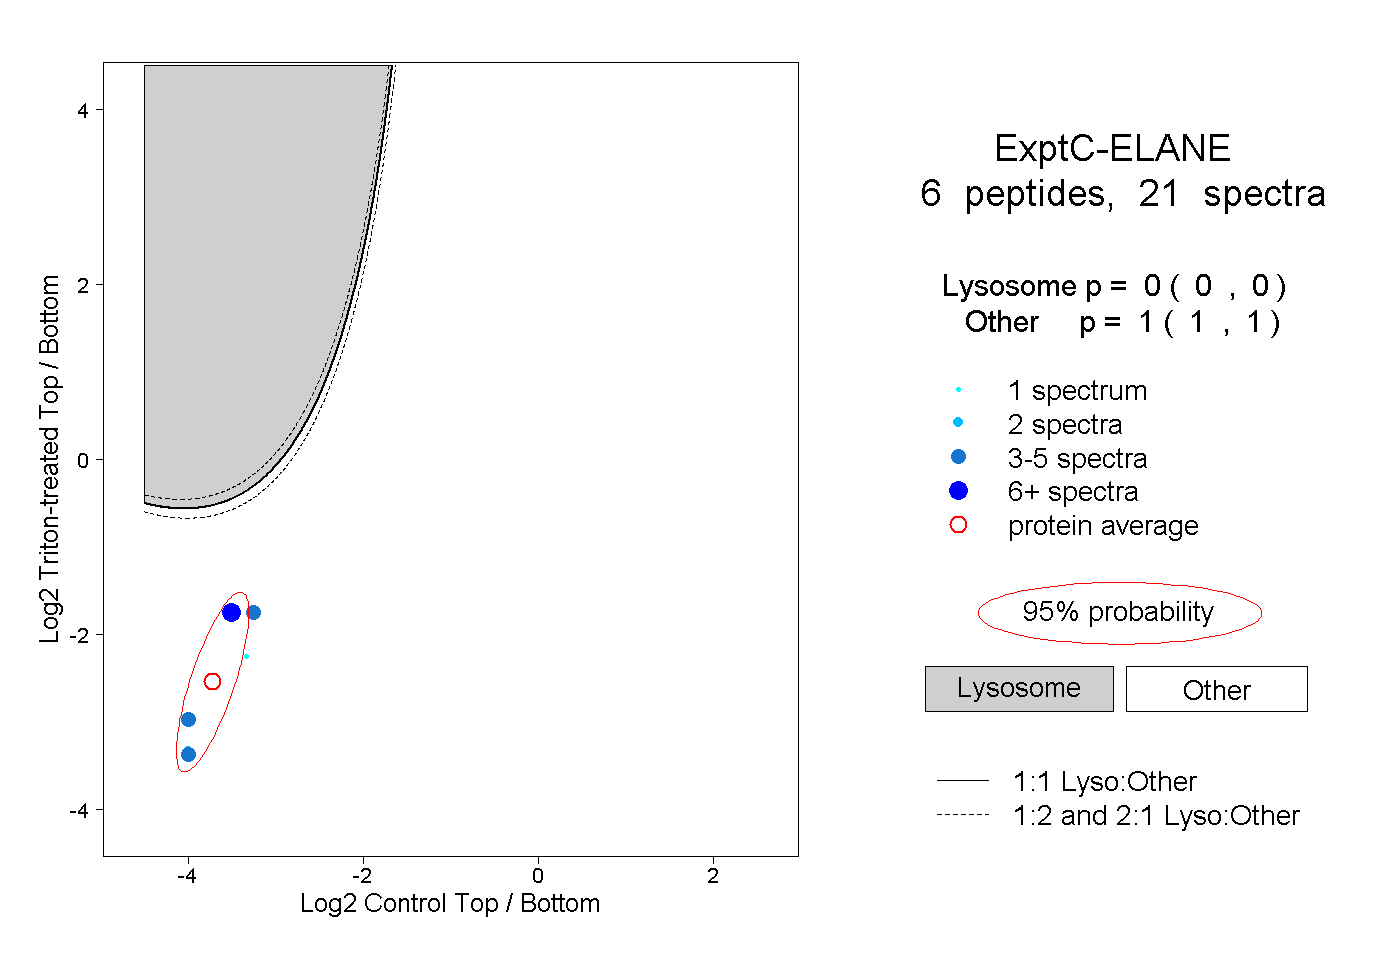
6
6peptides
spectra
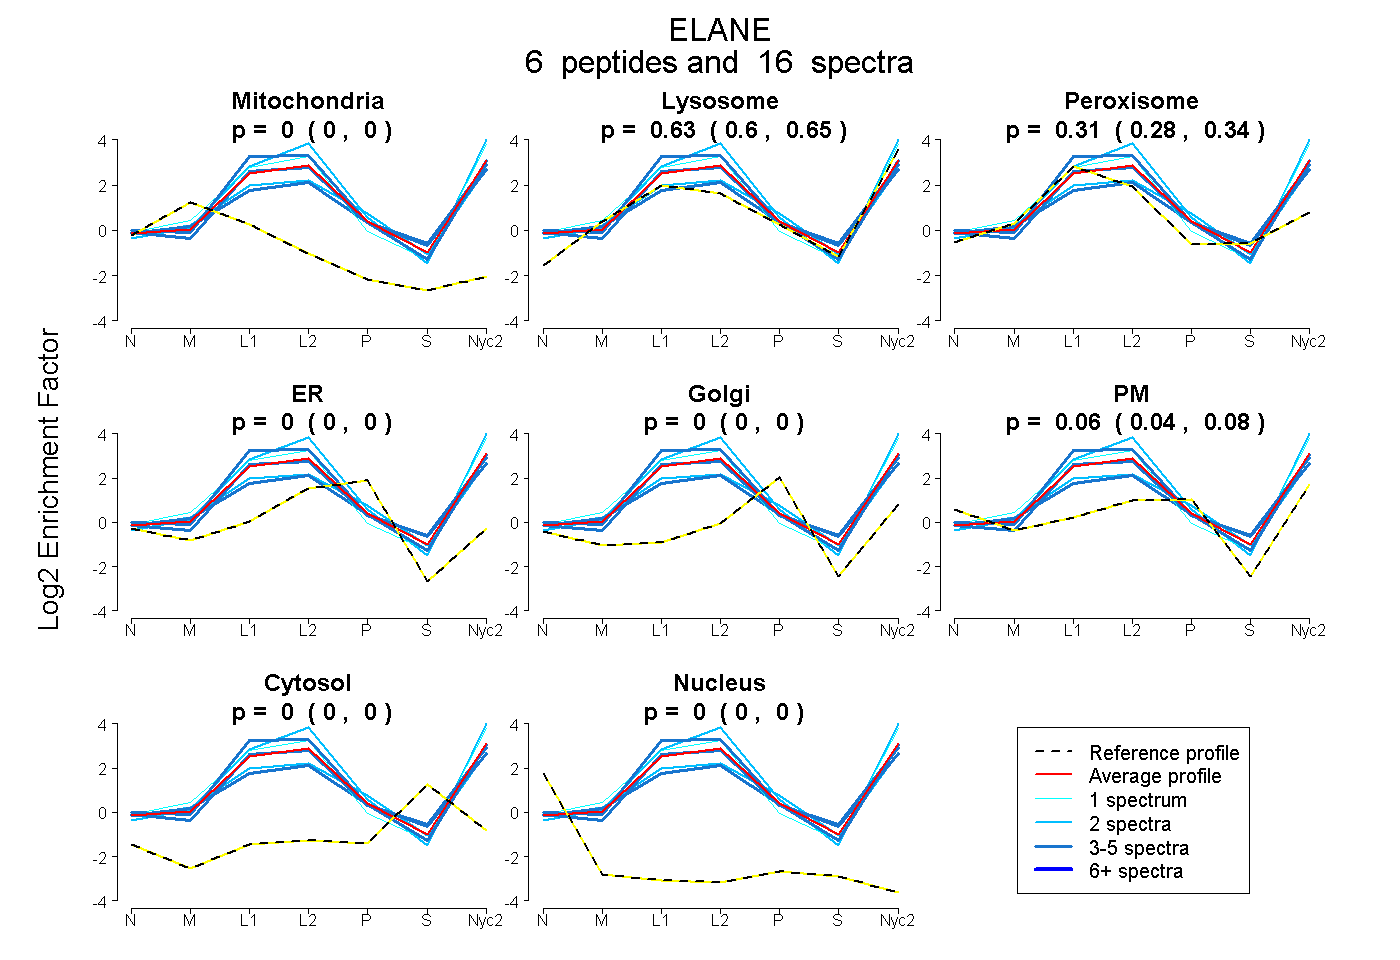
0.000 | 0.000
0.599 | 0.652
0.278 | 0.337
0.000 | 0.000
0.000 | 0.000
0.038 | 0.085
0.000 | 0.000
0.000 | 0.000
4peptides
spectra
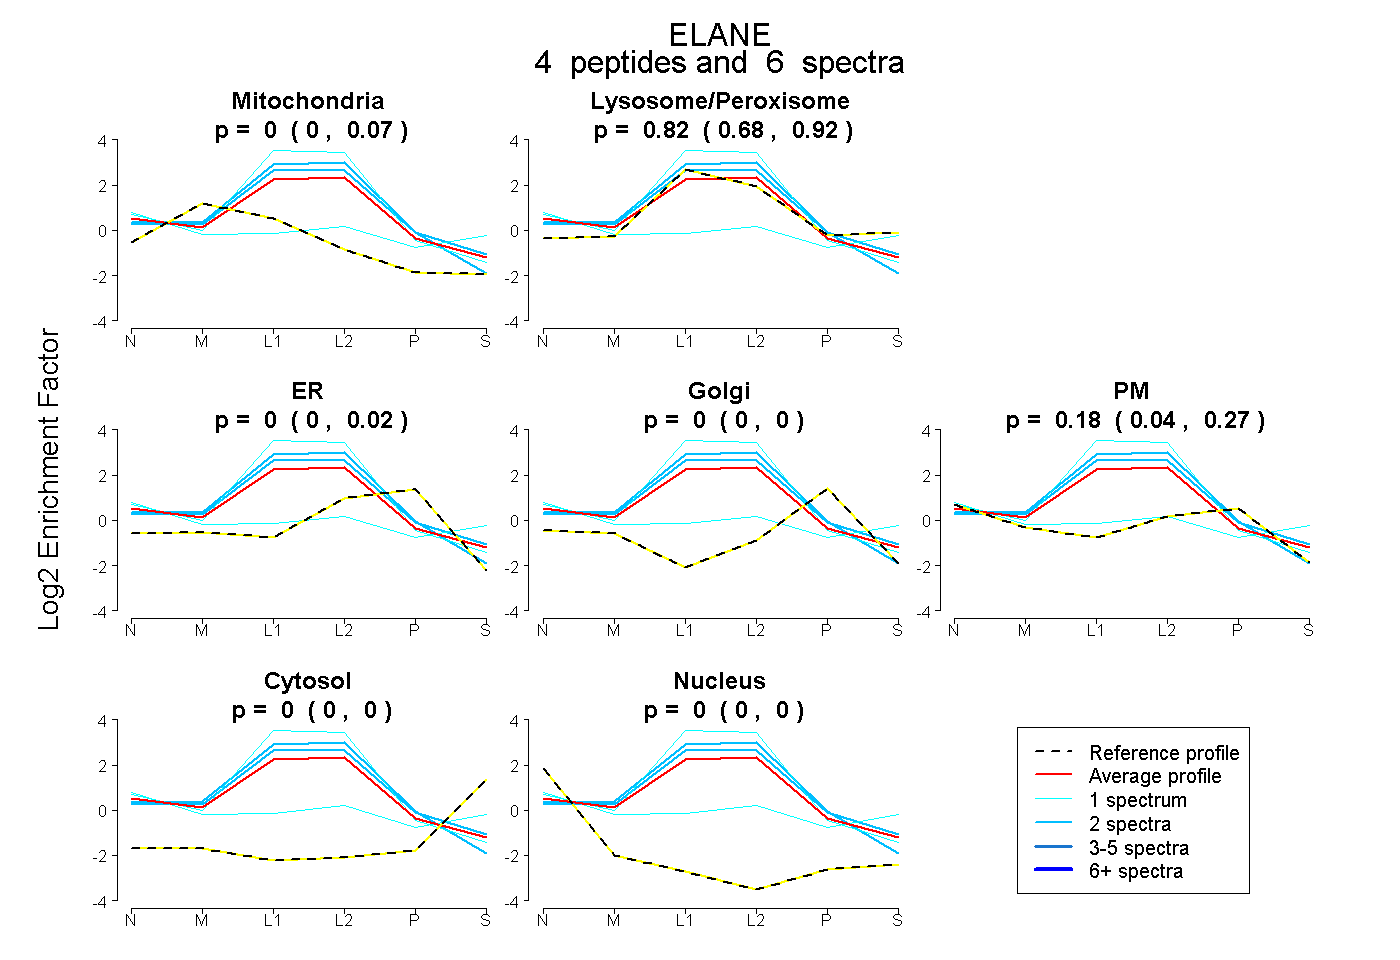
0.000 | 0.073
0.678 | 0.920
0.000 | 0.016
0.000 | 0.000
0.040 | 0.272
0.000 | 0.000
0.000 | 0.000