 6
6peptides
spectra
0.000 | 0.000
0.599 | 0.652
0.278 | 0.337
0.000 | 0.000
0.000 | 0.000
0.038 | 0.085
0.000 | 0.000
0.000 | 0.000
| Plot | Mito | Lyso | Perox | ER | Golgi | PM | Cytosol | Nucleus | |||||
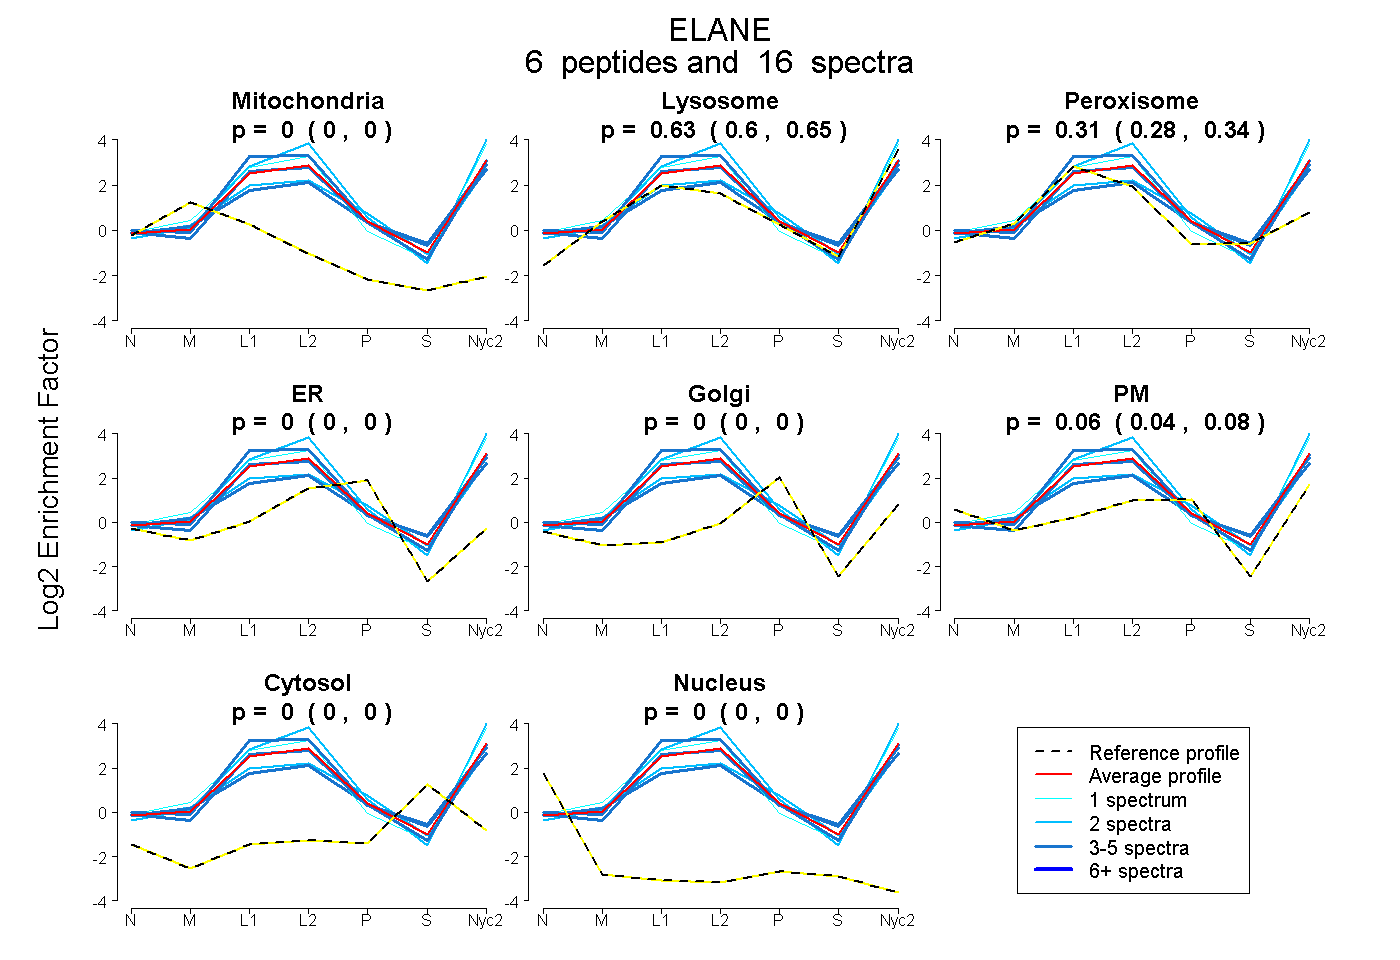
| Expt A |
6 peptides |
16 spectra |
|
0.000 0.000 | 0.000 |
0.628 0.599 | 0.652 |
0.310 0.278 | 0.337 |
0.000 0.000 | 0.000 |
0.000 0.000 | 0.000 |
0.063 0.038 | 0.085 |
0.000 0.000 | 0.000 |
0.000 0.000 | 0.000 |
| 4 spectra, VNVCTLVPR | 0.000 | 0.586 | 0.414 | 0.000 | 0.000 | 0.000 | 0.000 | 0.000 | ||
| 4 spectra, NFQSVQVVLGAHDLR | 0.000 | 0.494 | 0.298 | 0.000 | 0.000 | 0.207 | 0.000 | 0.000 | ||
| 2 spectra, GGHFCGATLIAR | 0.000 | 0.526 | 0.233 | 0.000 | 0.000 | 0.240 | 0.000 | 0.000 | ||
| 1 spectrum, QIFSVQR | 0.000 | 0.792 | 0.208 | 0.000 | 0.000 | 0.000 | 0.000 | 0.000 | ||
| 3 spectra, TPCVAMGWGR | 0.000 | 0.557 | 0.406 | 0.000 | 0.000 | 0.036 | 0.000 | 0.000 | ||
| 2 spectra, IFENGFDPSR | 0.000 | 0.913 | 0.087 | 0.000 | 0.000 | 0.000 | 0.000 | 0.000 |
| Plot | Mito | Lyso or Perox | ER | Golgi | PM | Cytosol | Nucleus | ||||||
| Expt B |
4 peptides |
6 spectra |
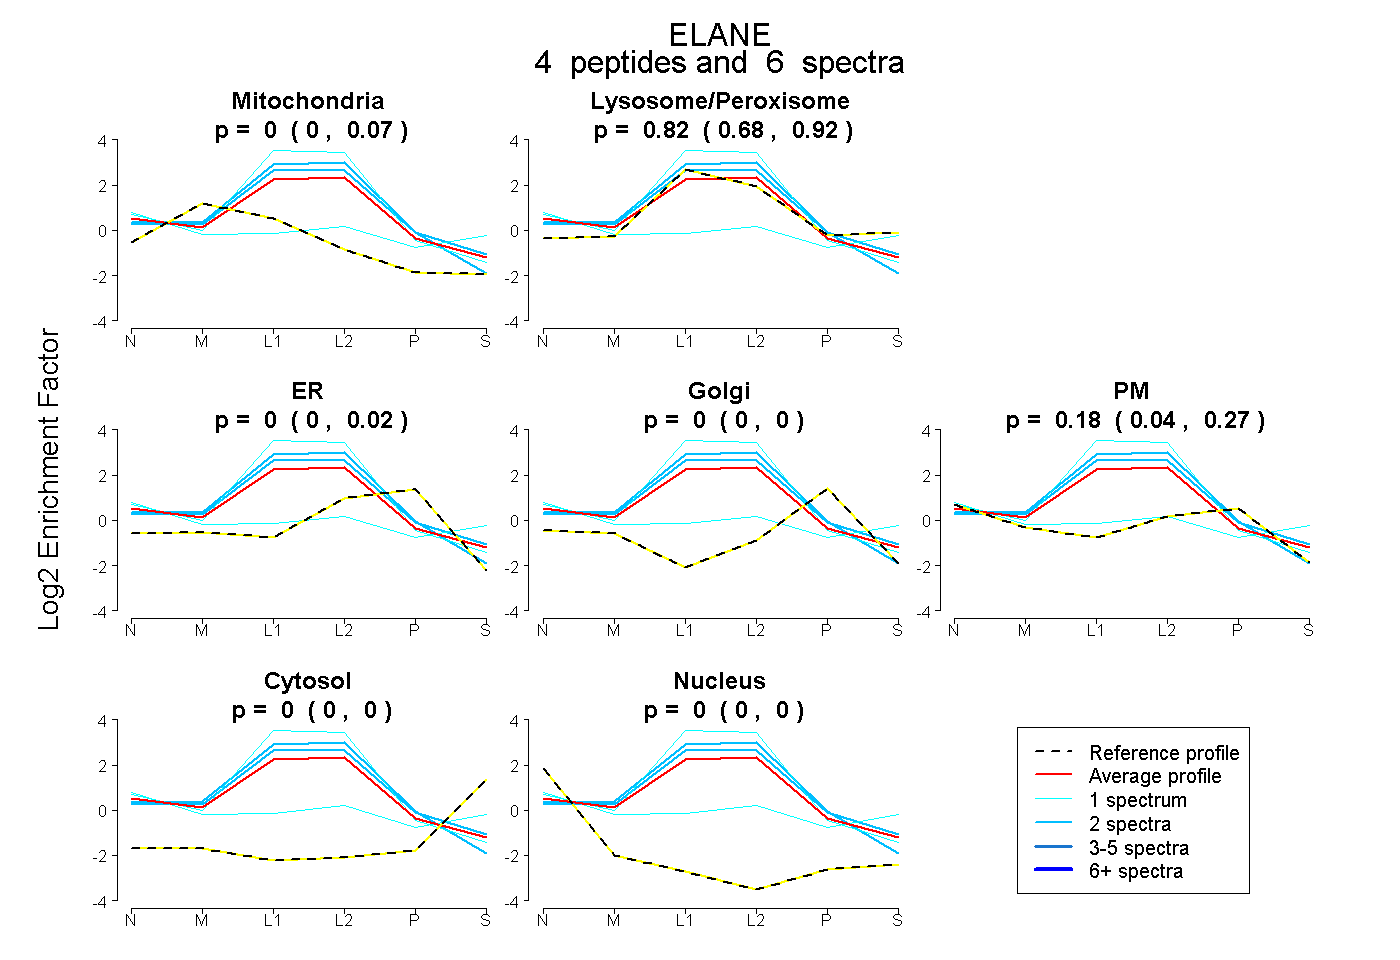 |
0.000 0.000 | 0.073 |
0.818 0.678 | 0.920 |
0.000 0.000 | 0.016 |
0.000 0.000 | 0.000 |
0.182 0.040 | 0.272 |
0.000 0.000 | 0.000 |
0.000 0.000 | 0.000 |
|||
| Plot | Lyso | Other | |||||||||||
| Expt C |
6 peptides |
21 spectra |
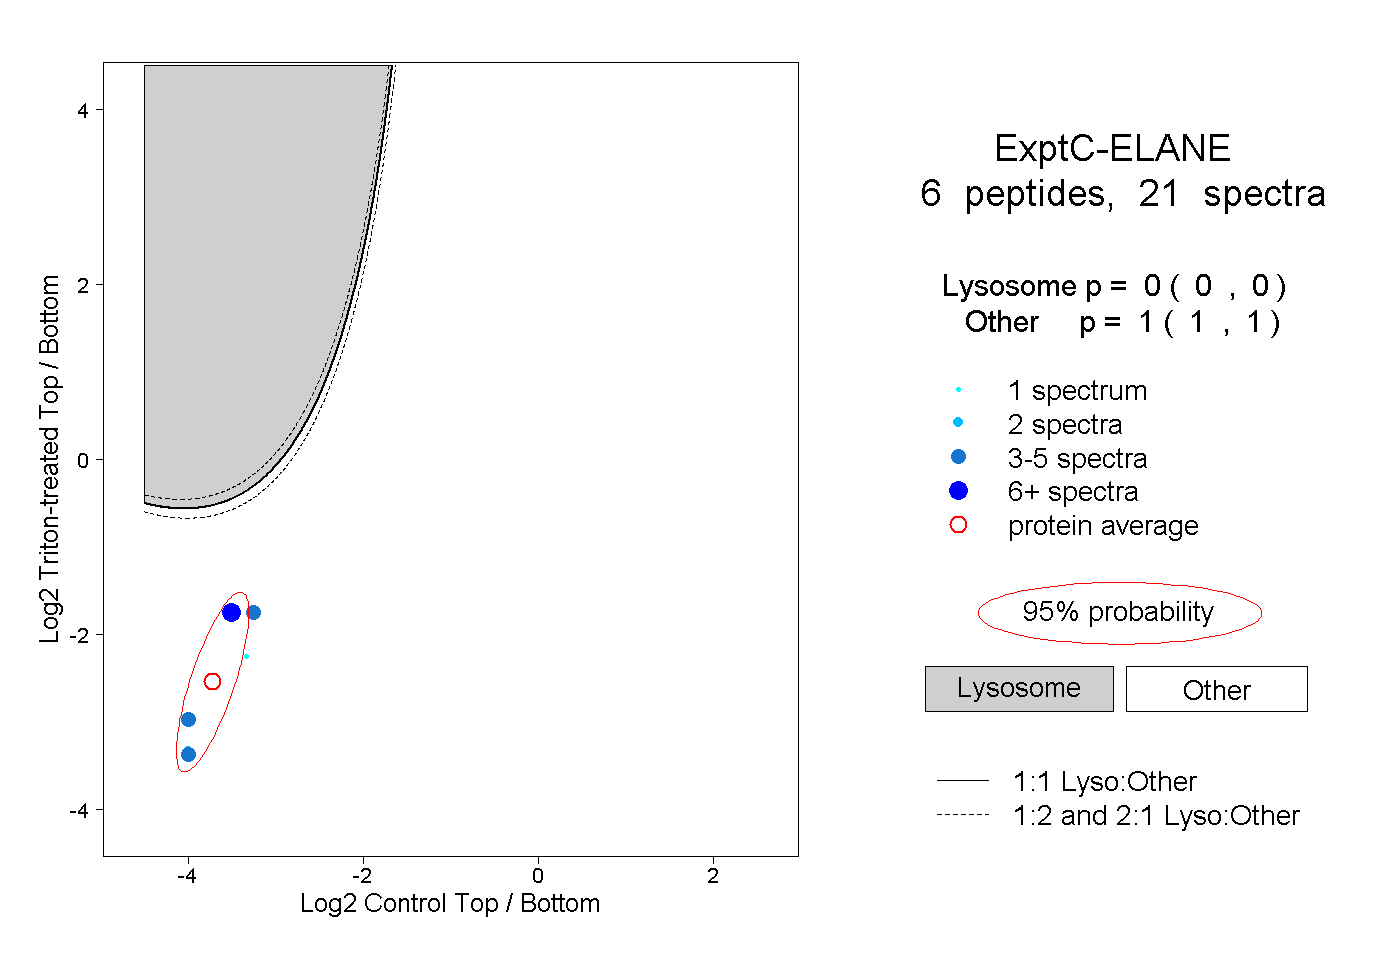 |
0.000 0.000 | 0.000 |
1.000 1.000 | 1.000 |