24
24peptides
spectra
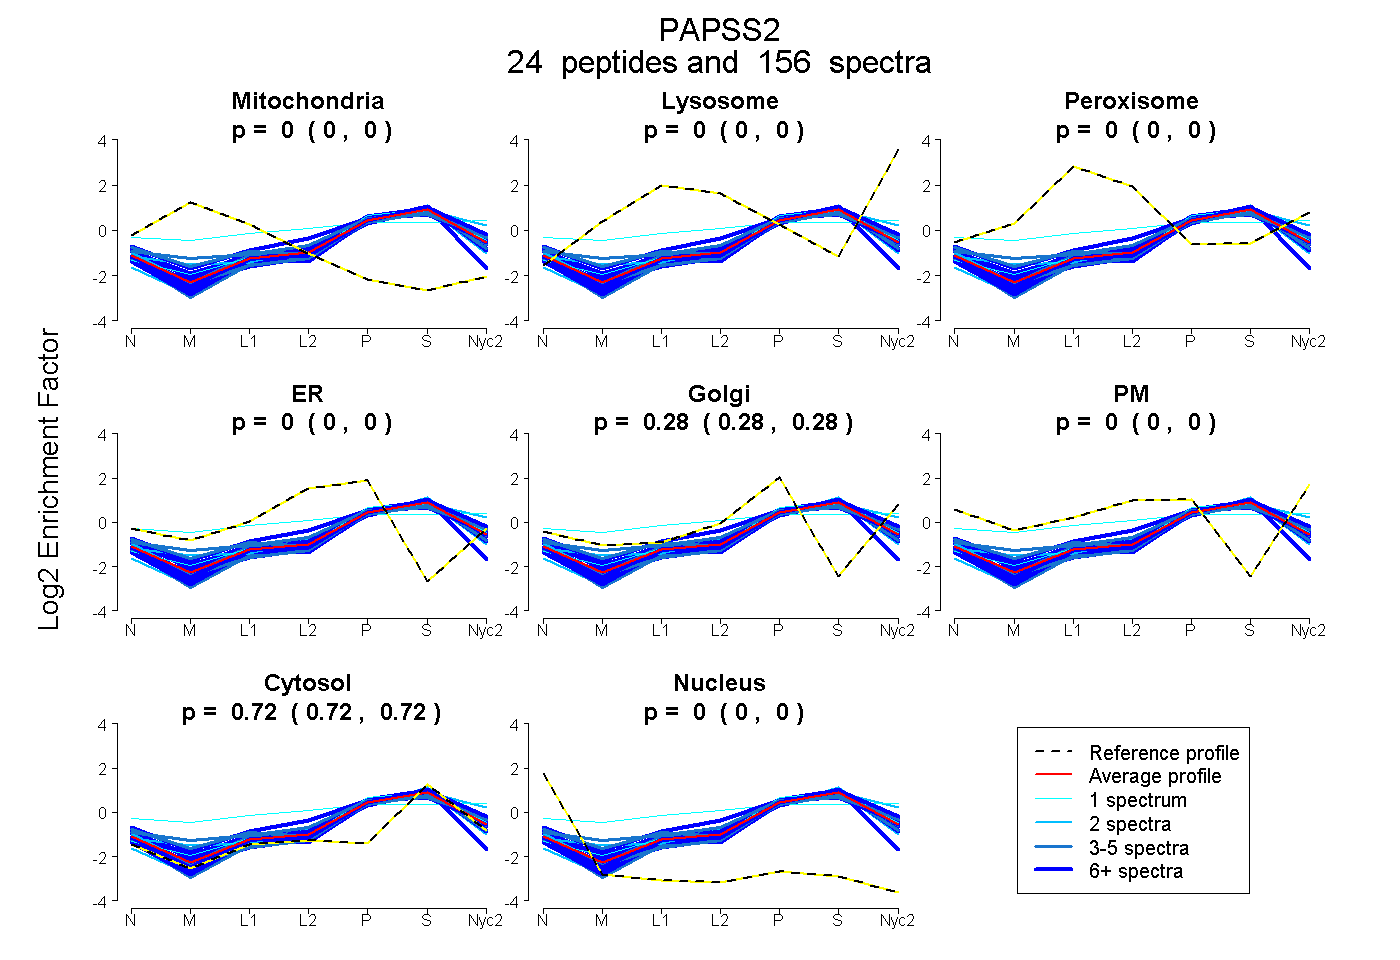
0.000 | 0.000
0.000 | 0.000
0.000 | 0.000
0.000 | 0.000
0.277 | 0.279
0.000 | 0.000
0.721 | 0.723
0.000 | 0.000
14peptides
spectra
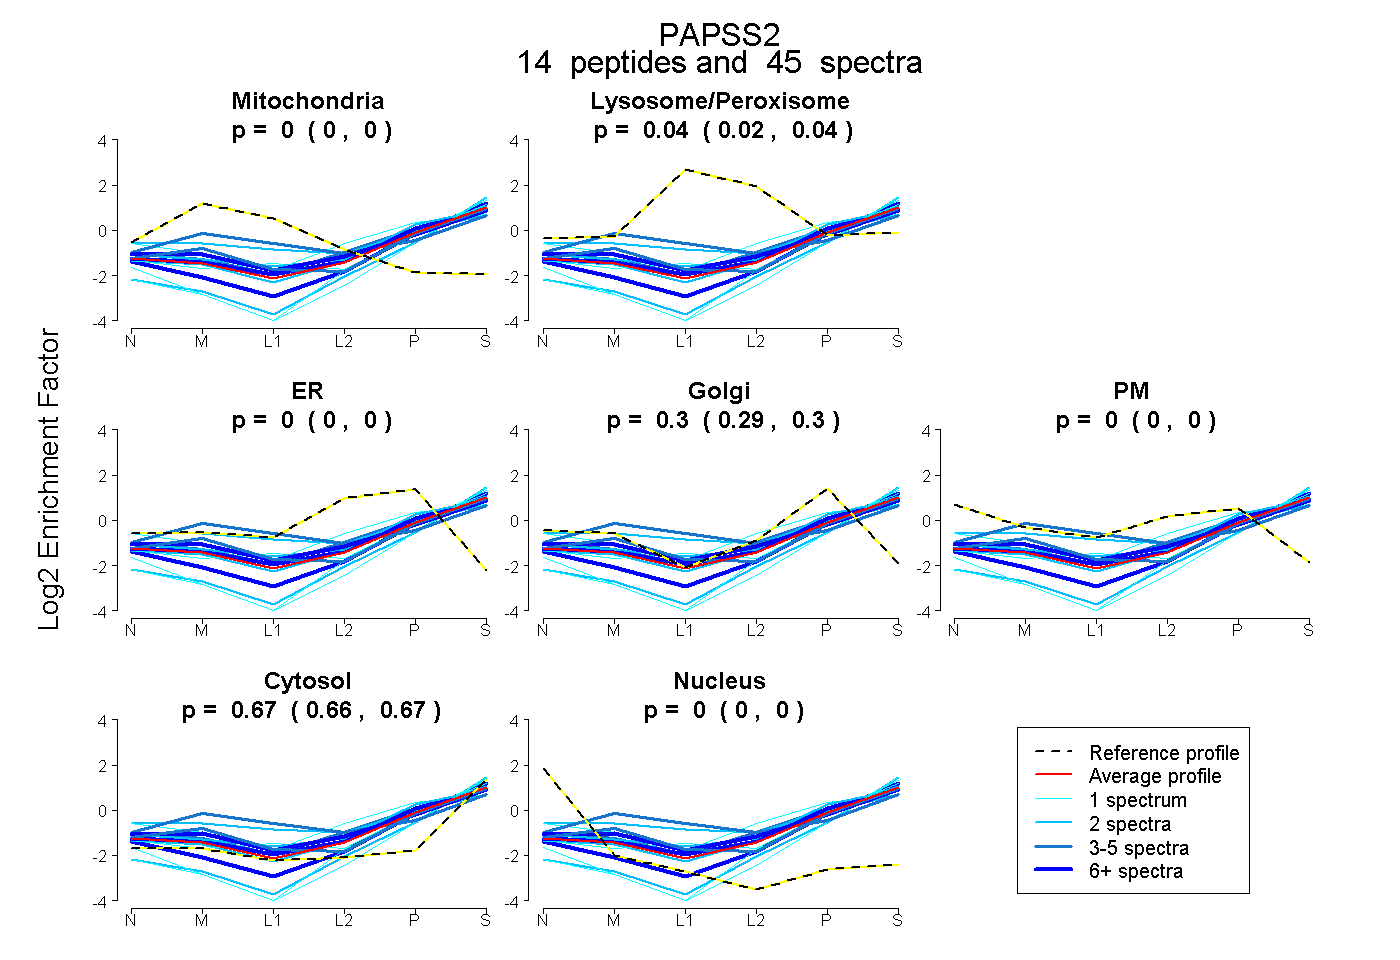
0.000 | 0.000
0.024 | 0.045
0.000 | 0.000
0.289 | 0.305
0.000 | 0.000
0.661 | 0.672
0.000 | 0.000