 24
24peptides
spectra
0.000 | 0.000
0.000 | 0.000
0.000 | 0.000
0.000 | 0.000
0.277 | 0.279
0.000 | 0.000
0.721 | 0.723
0.000 | 0.000
| Plot | Mito | Lyso | Perox | ER | Golgi | PM | Cytosol | Nucleus | |||||
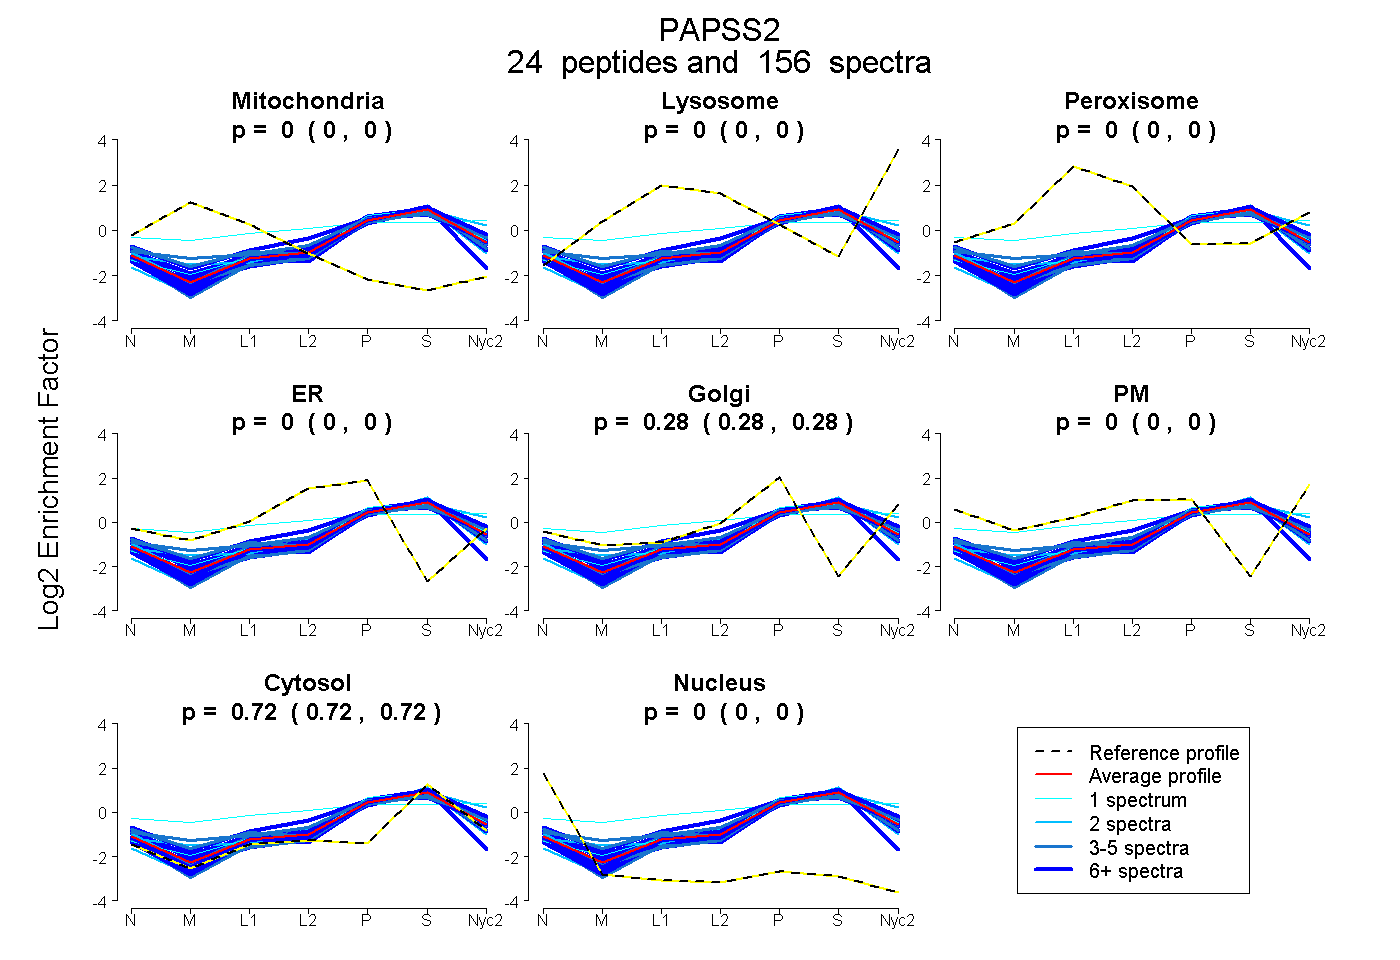
| Expt A |
24 peptides |
156 spectra |
|
0.000 0.000 | 0.000 |
0.000 0.000 | 0.000 |
0.000 0.000 | 0.000 |
0.000 0.000 | 0.000 |
0.278 0.277 | 0.279 |
0.000 0.000 | 0.000 |
0.722 0.721 | 0.723 |
0.000 0.000 | 0.000 |
| 3 spectra, VLTDYYR | 0.000 | 0.000 | 0.045 | 0.000 | 0.307 | 0.000 | 0.648 | 0.000 | ||
| 13 spectra, MIAGANFYIVGR | 0.000 | 0.000 | 0.000 | 0.000 | 0.196 | 0.000 | 0.804 | 0.000 | ||
| 3 spectra, AELETLPSLPITK | 0.000 | 0.000 | 0.000 | 0.000 | 0.230 | 0.000 | 0.770 | 0.000 | ||
| 11 spectra, VALLQDPEFYEHR | 0.000 | 0.000 | 0.043 | 0.176 | 0.169 | 0.000 | 0.611 | 0.000 | ||
| 1 spectrum, QHAAVLEEGILDPK | 0.000 | 0.023 | 0.249 | 0.000 | 0.155 | 0.179 | 0.394 | 0.000 | ||
| 3 spectra, LTPLELK | 0.000 | 0.000 | 0.000 | 0.000 | 0.216 | 0.000 | 0.784 | 0.000 | ||
| 22 spectra, DDDVPLDWR | 0.000 | 0.000 | 0.000 | 0.000 | 0.231 | 0.000 | 0.769 | 0.000 | ||
| 10 spectra, LEGCSK | 0.000 | 0.000 | 0.000 | 0.105 | 0.068 | 0.000 | 0.819 | 0.009 | ||
| 1 spectrum, GIHELFVPENK | 0.000 | 0.000 | 0.000 | 0.000 | 0.262 | 0.000 | 0.738 | 0.000 | ||
| 4 spectra, ITIPELK | 0.000 | 0.000 | 0.000 | 0.000 | 0.289 | 0.000 | 0.711 | 0.000 | ||
| 1 spectrum, VLSMAPGLTSVEIIPFR | 0.000 | 0.000 | 0.000 | 0.000 | 0.311 | 0.000 | 0.689 | 0.000 | ||
| 10 spectra, DPAGMPHPETK | 0.000 | 0.000 | 0.000 | 0.000 | 0.226 | 0.000 | 0.774 | 0.000 | ||
| 9 spectra, FALMYEGR | 0.000 | 0.000 | 0.000 | 0.000 | 0.267 | 0.000 | 0.733 | 0.000 | ||
| 6 spectra, GQVVGTR | 0.000 | 0.000 | 0.016 | 0.000 | 0.286 | 0.000 | 0.698 | 0.000 | ||
| 11 spectra, EGEDPPDGFMAPK | 0.000 | 0.000 | 0.001 | 0.016 | 0.311 | 0.000 | 0.673 | 0.000 | ||
| 8 spectra, NPVHNGHALLMQDTR | 0.000 | 0.000 | 0.000 | 0.000 | 0.273 | 0.000 | 0.727 | 0.000 | ||
| 2 spectra, NLGFSAGDR | 0.000 | 0.067 | 0.000 | 0.000 | 0.298 | 0.000 | 0.636 | 0.000 | ||
| 6 spectra, WNDGLDQYR | 0.000 | 0.000 | 0.000 | 0.000 | 0.270 | 0.000 | 0.730 | 0.000 | ||
| 2 spectra, AMDFYDPAR | 0.000 | 0.000 | 0.000 | 0.000 | 0.173 | 0.000 | 0.827 | 0.000 | ||
| 7 spectra, DLYEPTHGGK | 0.000 | 0.000 | 0.000 | 0.006 | 0.299 | 0.000 | 0.694 | 0.000 | ||
| 12 spectra, HDEFDFISGTR | 0.000 | 0.000 | 0.000 | 0.032 | 0.273 | 0.000 | 0.695 | 0.000 | ||
| 2 spectra, HPVLLLHPLGGWTK | 0.000 | 0.000 | 0.000 | 0.007 | 0.225 | 0.000 | 0.769 | 0.000 | ||
| 4 spectra, VWGTASAK | 0.000 | 0.000 | 0.069 | 0.000 | 0.345 | 0.000 | 0.586 | 0.000 | ||
| 5 spectra, VAAYNK | 0.000 | 0.000 | 0.000 | 0.000 | 0.240 | 0.000 | 0.760 | 0.000 |
| Plot | Mito | Lyso or Perox | ER | Golgi | PM | Cytosol | Nucleus | ||||||
| Expt B |
14 peptides |
45 spectra |
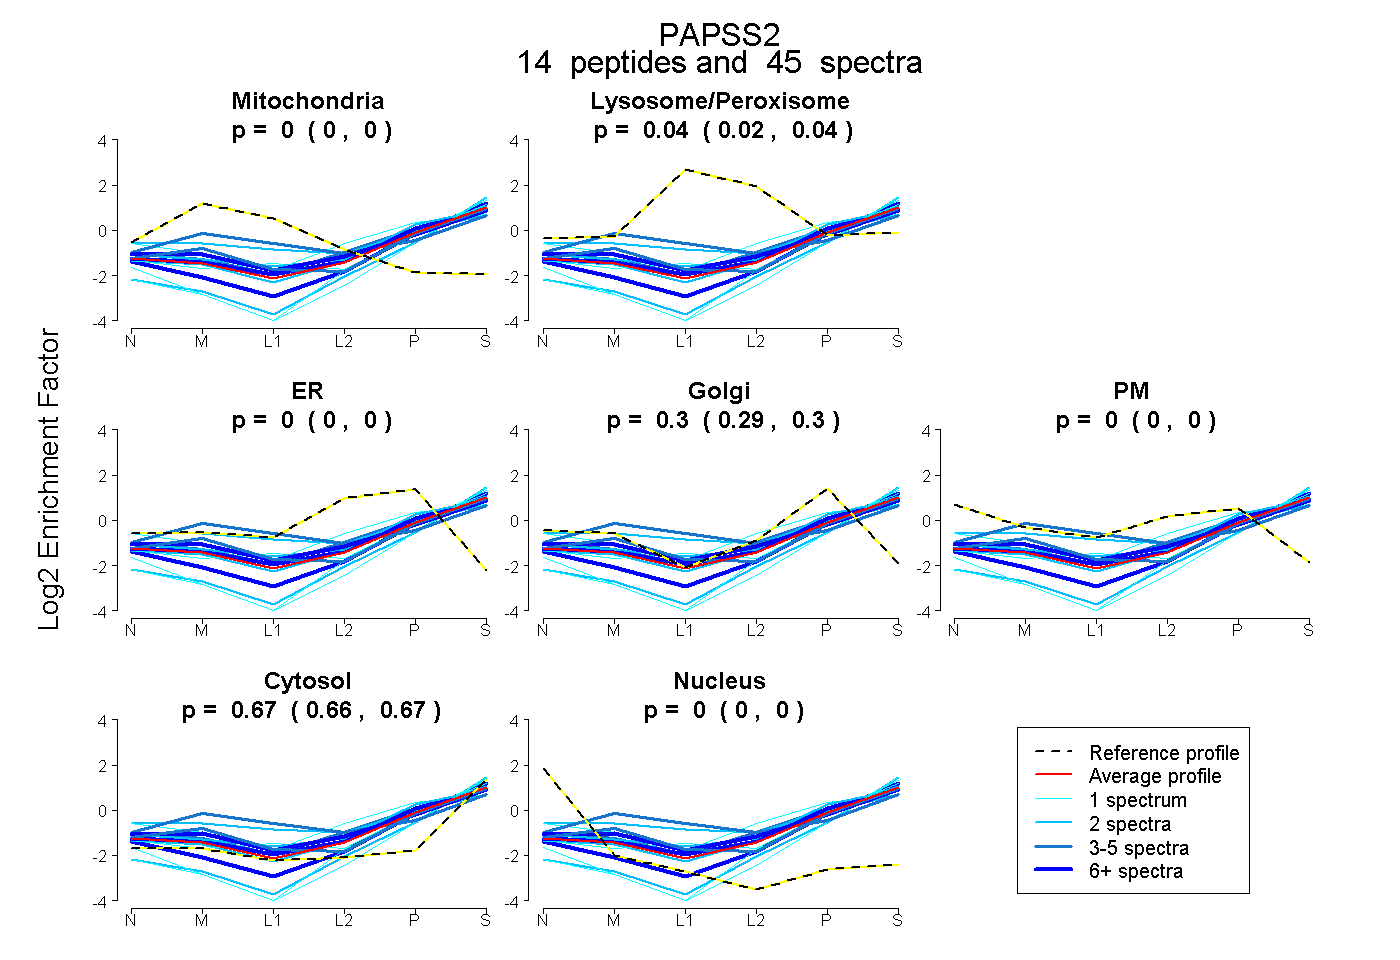 |
0.000 0.000 | 0.000 |
0.035 0.024 | 0.045 |
0.000 0.000 | 0.000 |
0.298 0.289 | 0.305 |
0.000 0.000 | 0.000 |
0.667 0.661 | 0.672 |
0.000 0.000 | 0.000 |
|||
| Plot | Lyso | Other | |||||||||||
| Expt C |
21 peptides |
134 spectra |
 |
0.000 0.000 | 0.000 |
1.000 1.000 | 1.000 |
||||||||
| Plot | Lyso | Other | |||||||||||
| Expt D |
7 peptides |
10 spectra |
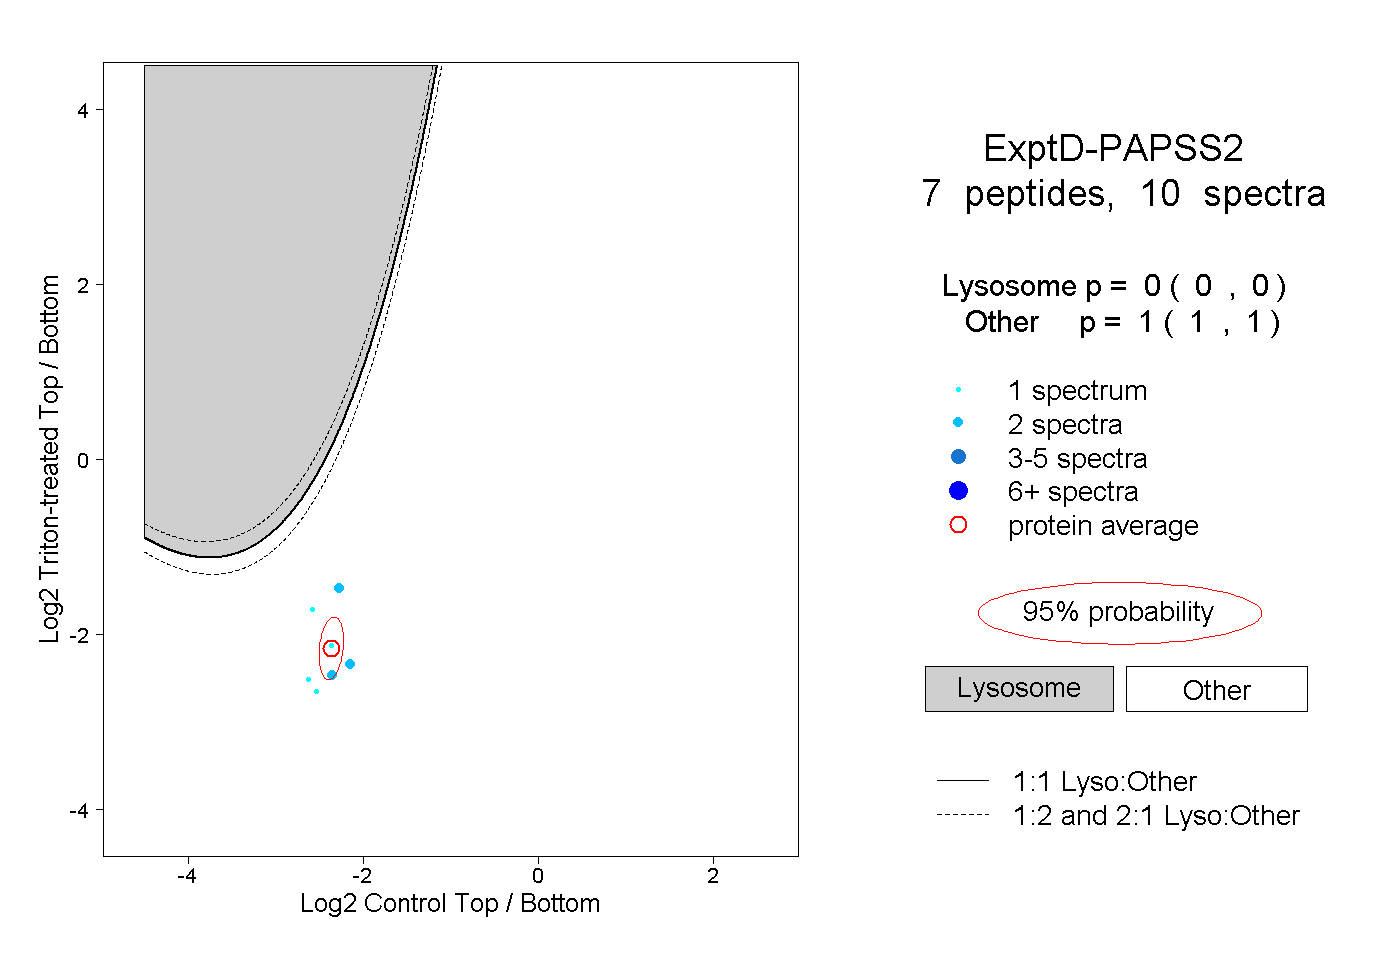 |
0.000 0.000 | 0.000 |
1.000 1.000 | 1.000 |