 6
6peptides
spectra
0.000 | 0.000
0.000 | 0.000
0.004 | 0.125
0.000 | 0.119
0.000 | 0.000
0.429 | 0.629
0.300 | 0.384
0.000 | 0.000
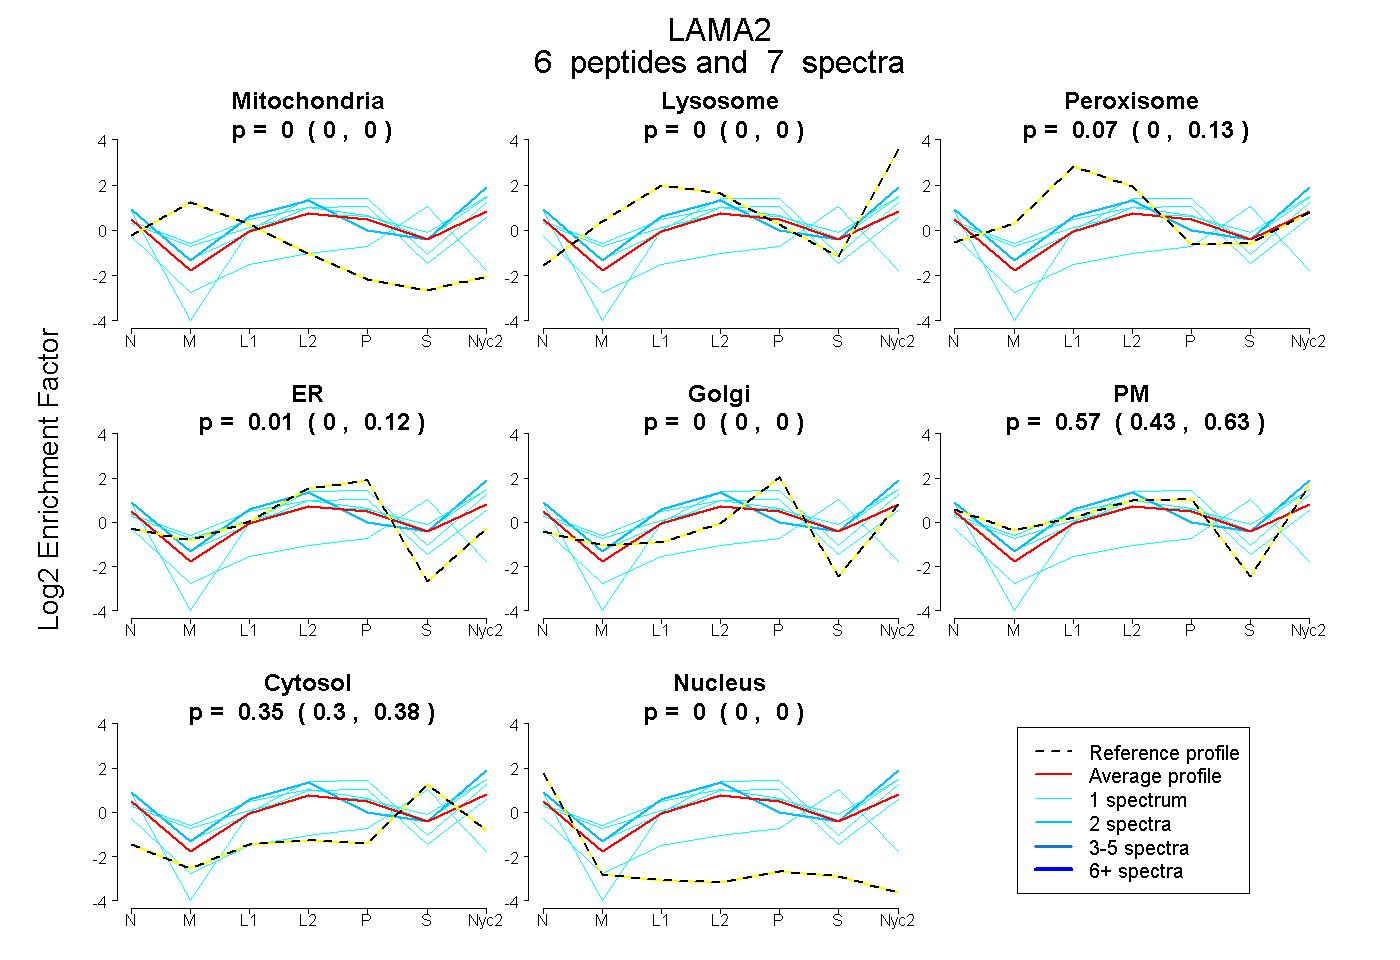
| Plot | Mito | Lyso | Perox | ER | Golgi | PM | Cytosol | Nucleus | |||||
| Expt A |
6 peptides |
7 spectra |
|
0.000 0.000 | 0.000 |
0.000 0.000 | 0.000 |
0.069 0.004 | 0.125 |
0.008 0.000 | 0.119 |
0.000 0.000 | 0.000 |
0.574 0.429 | 0.629 |
0.349 0.300 | 0.384 |
0.000 0.000 | 0.000 |
| 1 spectrum, HLLSPQR | 0.000 | 0.097 | 0.196 | 0.000 | 0.000 | 0.514 | 0.193 | 0.000 | ||
| 2 spectra, LDDAWDLLR | 0.000 | 0.077 | 0.216 | 0.000 | 0.000 | 0.520 | 0.187 | 0.000 | ||
| 1 spectrum, ISTAYK | 0.000 | 0.000 | 0.000 | 0.080 | 0.000 | 0.000 | 0.790 | 0.129 | ||
| 1 spectrum, HMAAPLIGQLTR | 0.000 | 0.000 | 0.000 | 0.261 | 0.000 | 0.477 | 0.262 | 0.000 | ||
| 1 spectrum, EGNDILDEANR | 0.000 | 0.000 | 0.000 | 0.255 | 0.000 | 0.570 | 0.151 | 0.024 | ||
| 1 spectrum, LVEHVPGQPVR | 0.000 | 0.155 | 0.075 | 0.000 | 0.000 | 0.494 | 0.277 | 0.000 |
| Plot | Lyso | Other | |||||||||||
| Expt C |
3 peptides |
7 spectra |
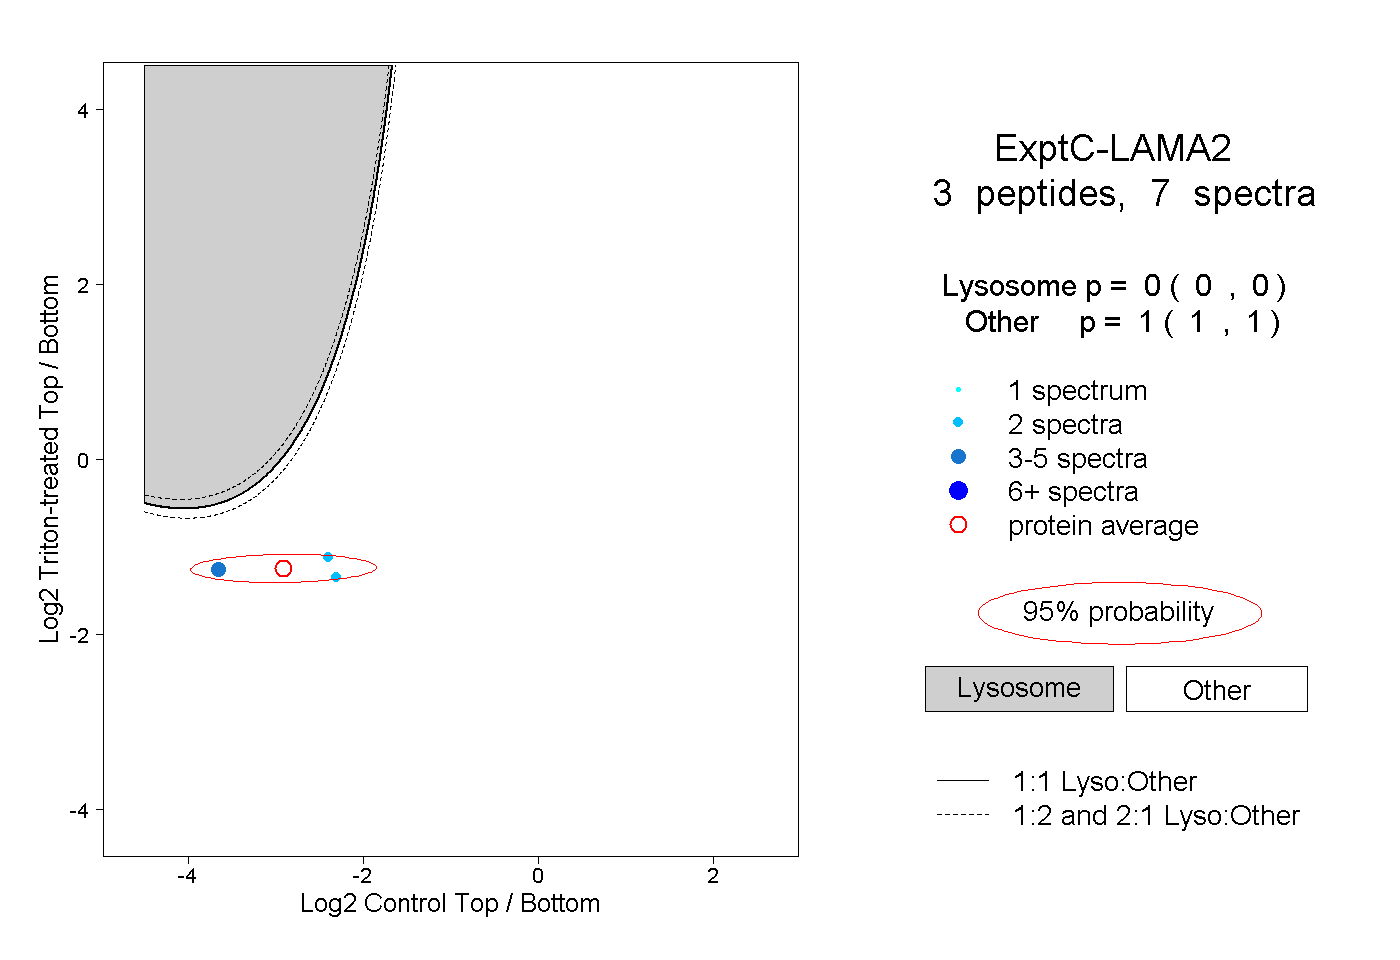 |
0.000 0.000 | 0.000 |
1.000 1.000 | 1.000 |