 8
8peptides
spectra
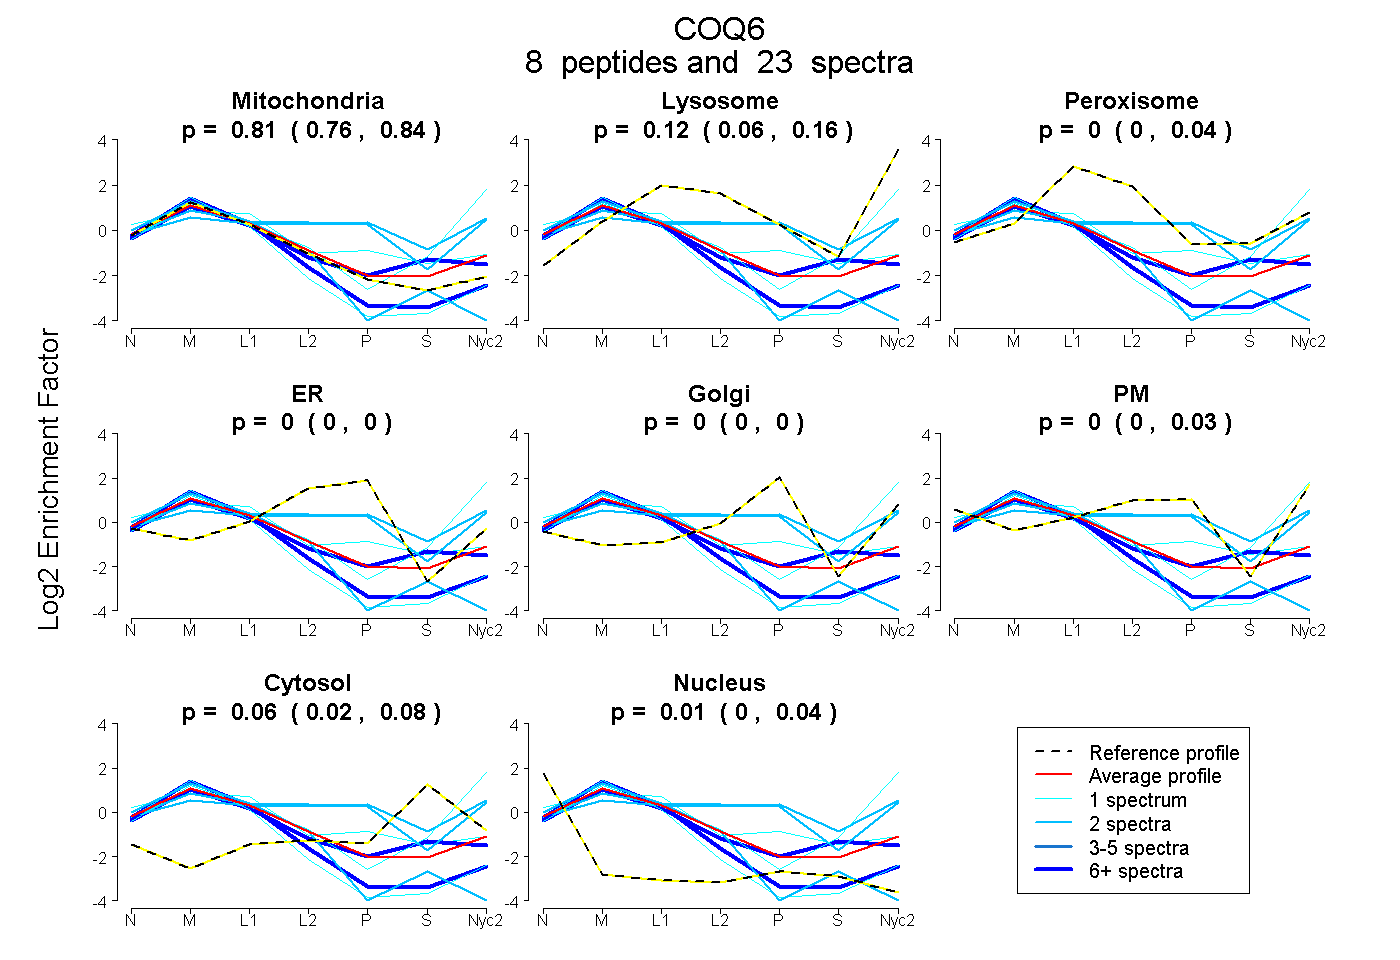
0.762 | 0.842
0.057 | 0.164
0.000 | 0.035
0.000 | 0.000
0.000 | 0.000
0.000 | 0.034
0.015 | 0.077
0.000 | 0.037
3peptides
spectra
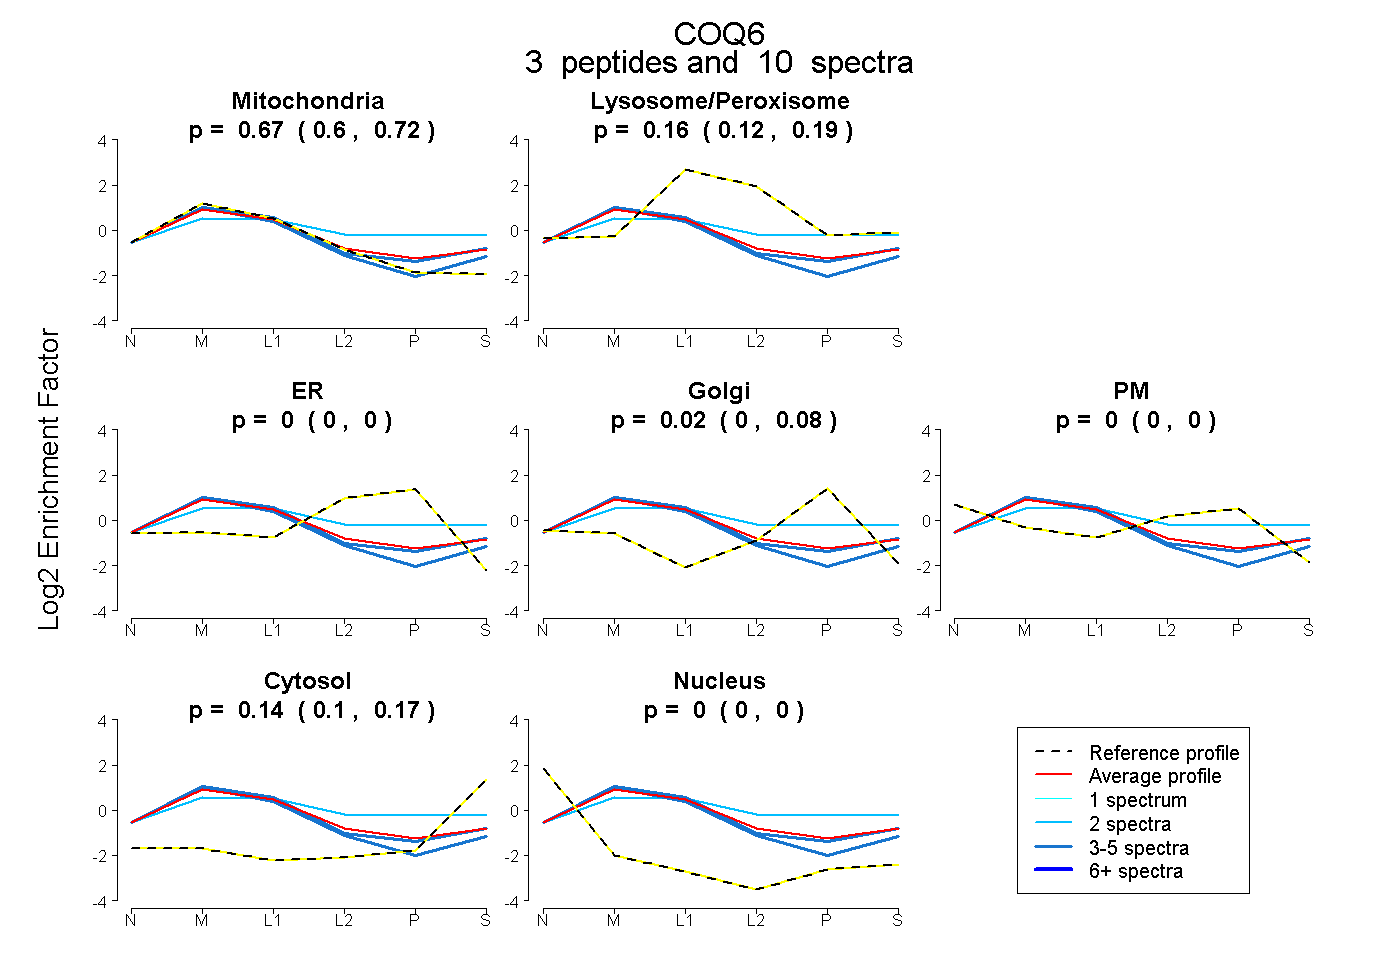
0.599 | 0.720
0.122 | 0.193
0.000 | 0.000
0.000 | 0.081
0.000 | 0.000
0.099 | 0.171
0.000 | 0.000
12peptides
spectra
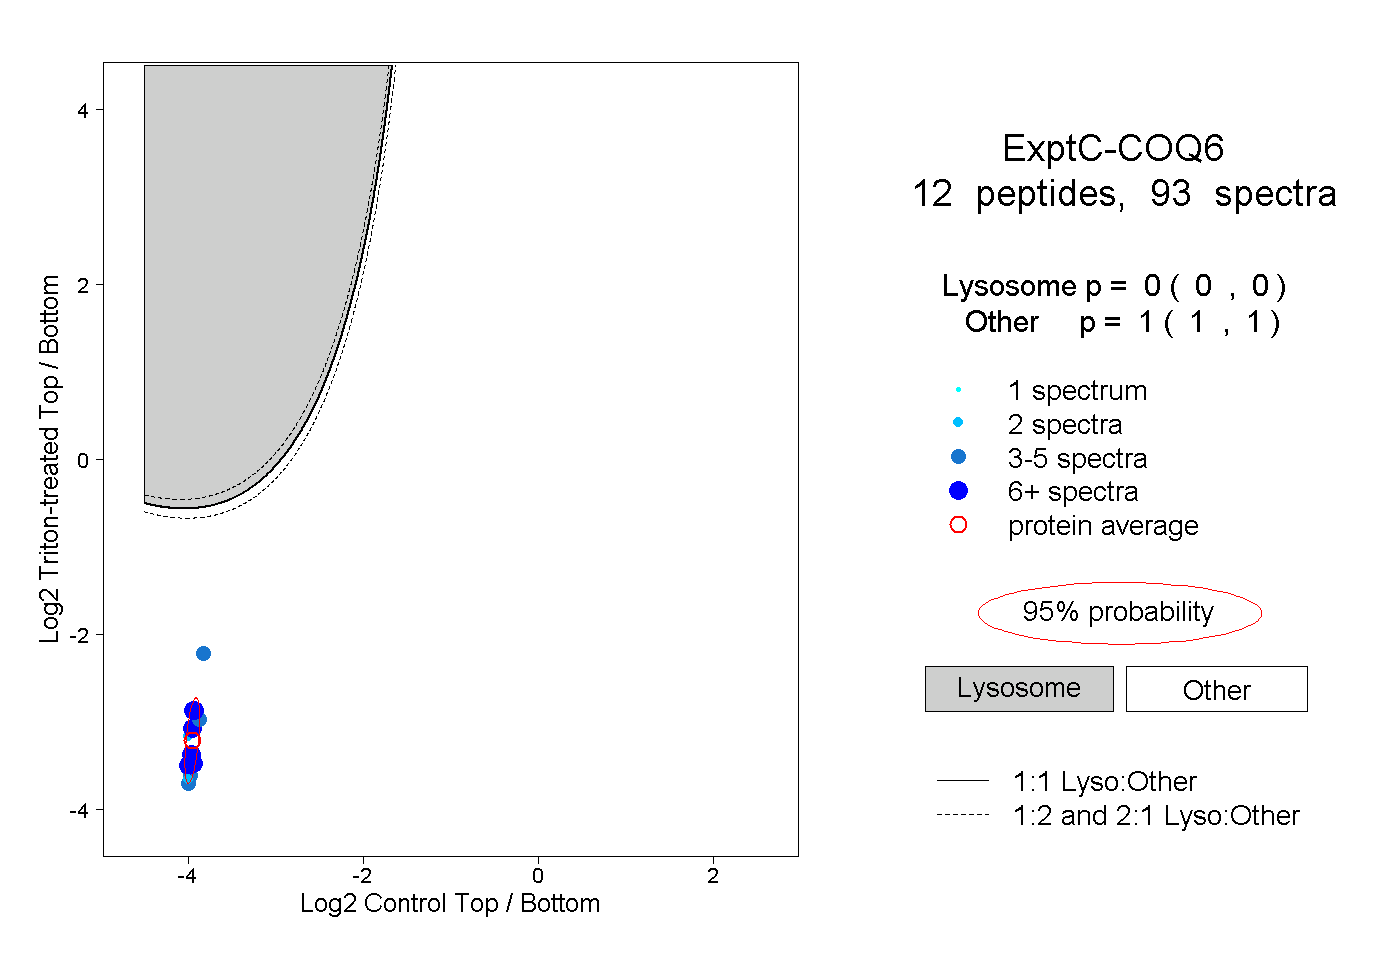
0.000 | 0.000
1.000 | 1.000
1peptide
spectrum
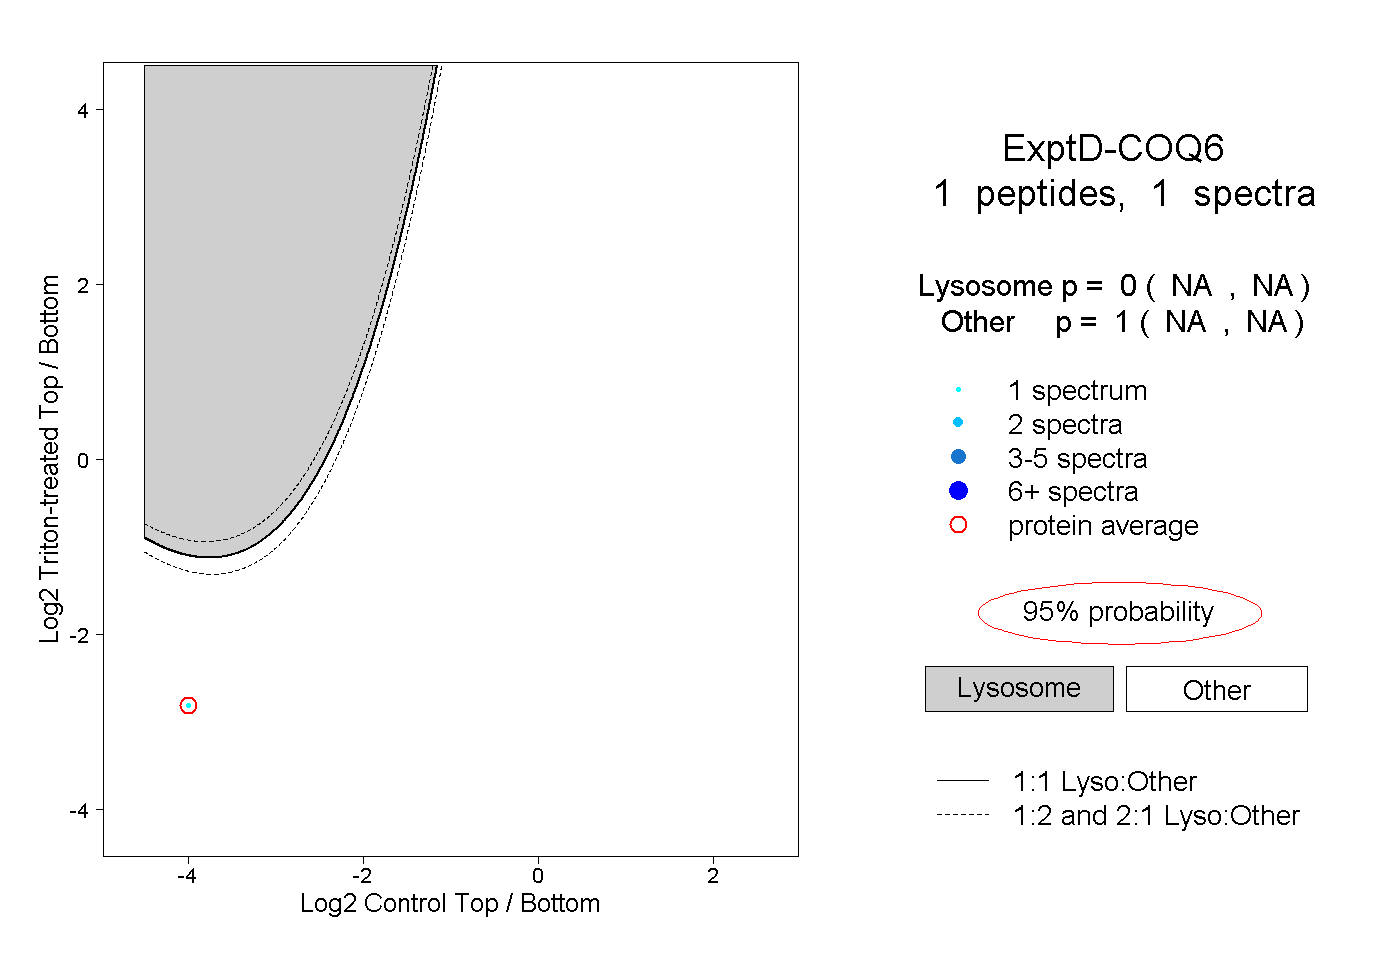
NA | NA
NA | NA