 1
1peptide
spectra
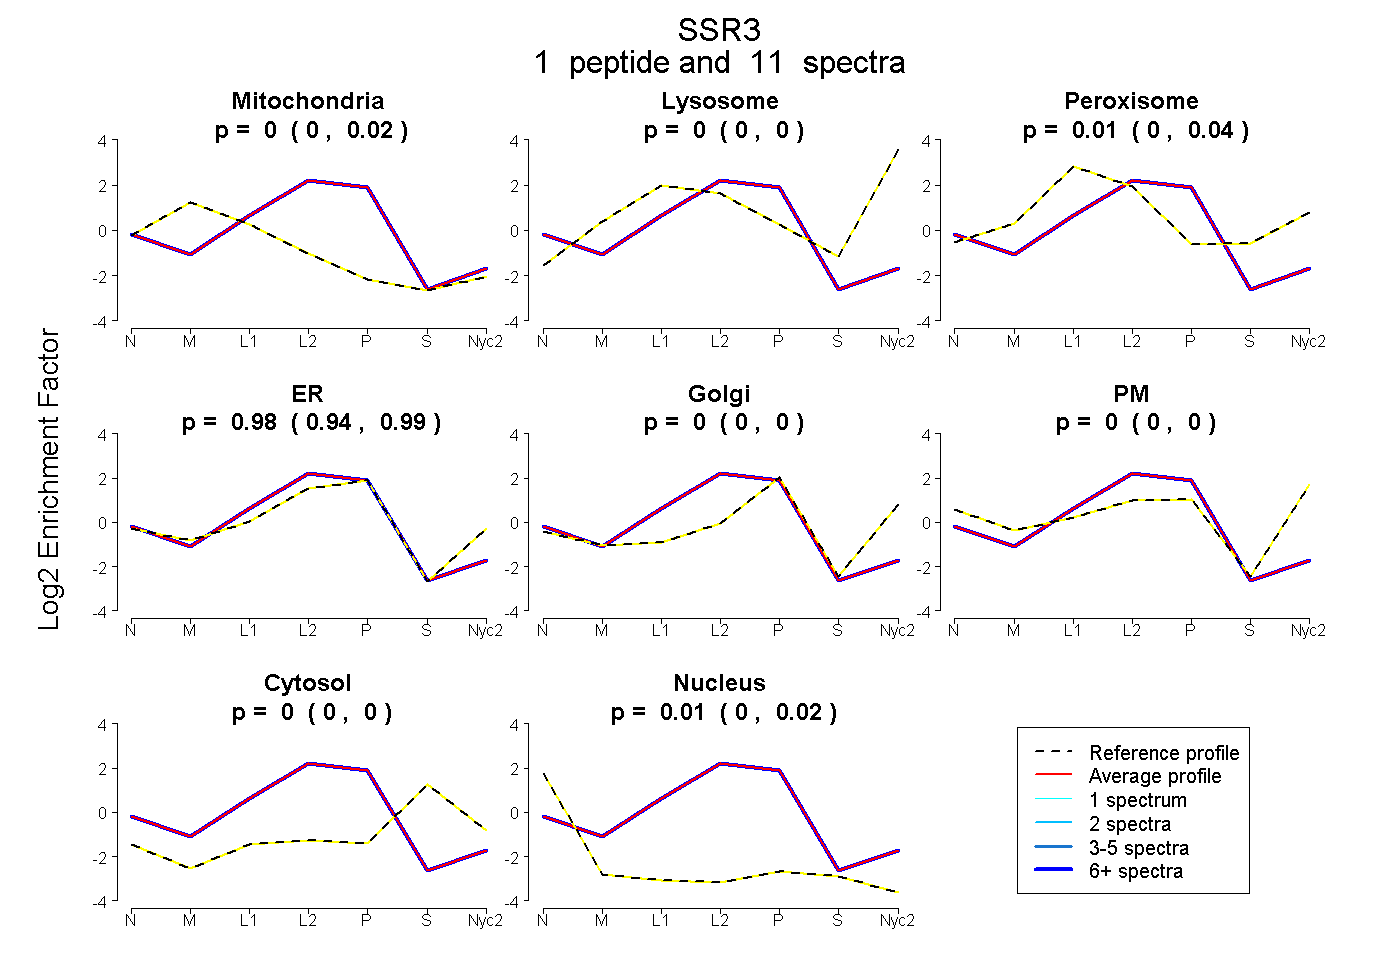
0.000 | 0.021
0.000 | 0.000
0.000 | 0.039
0.942 | 0.991
0.000 | 0.000
0.000 | 0.000
0.000 | 0.000
0.000 | 0.021
1peptide
spectrum
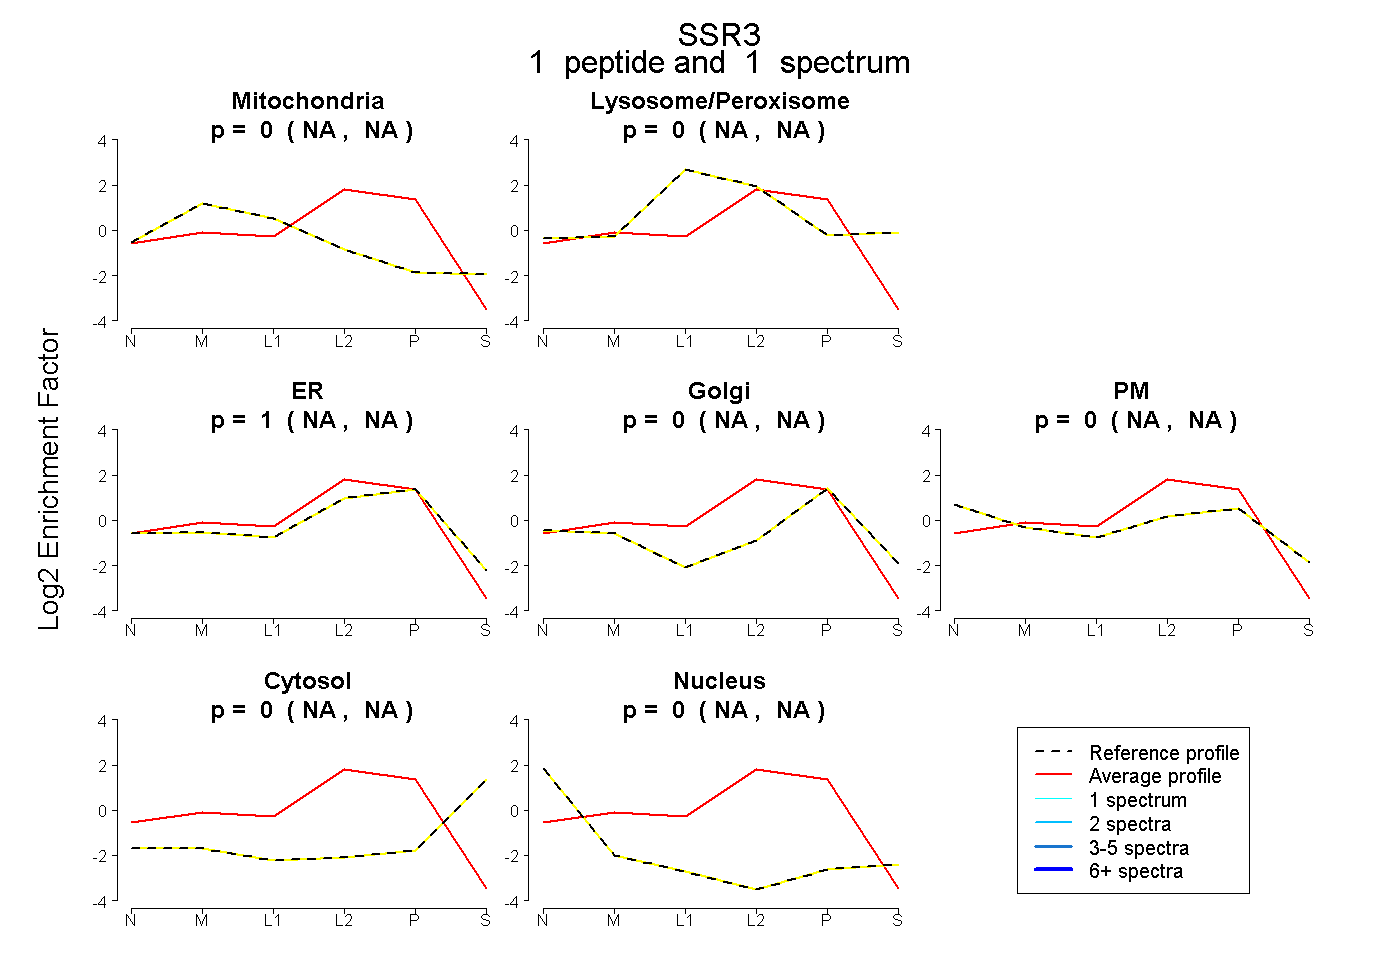
NA | NA
NA | NA
NA | NA
NA | NA
NA | NA
NA | NA
NA | NA
1peptide
spectrum
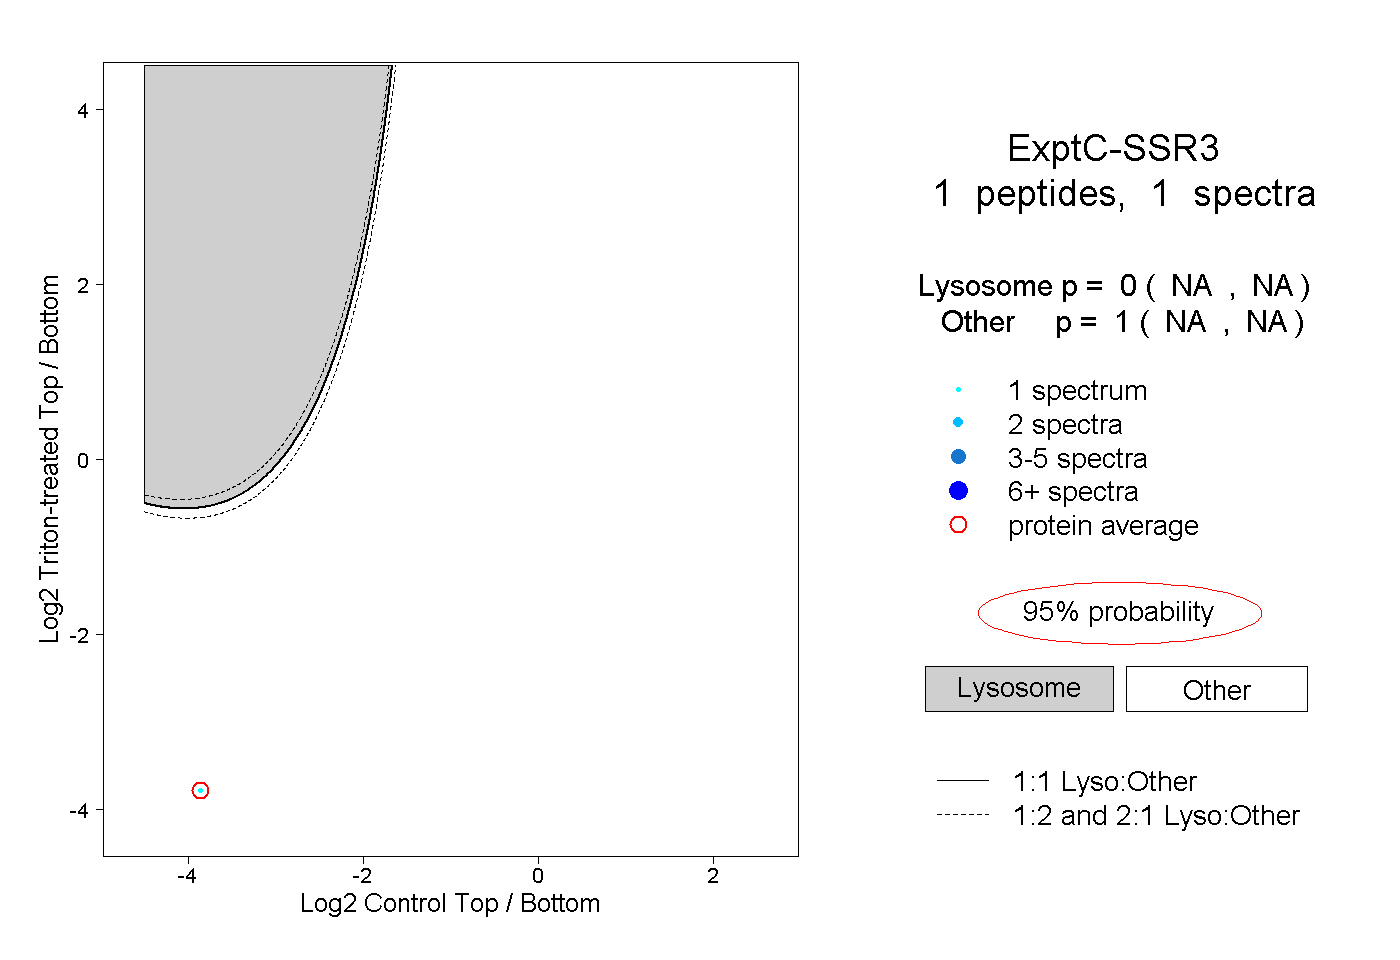
NA | NA
NA | NA
1peptide
spectra
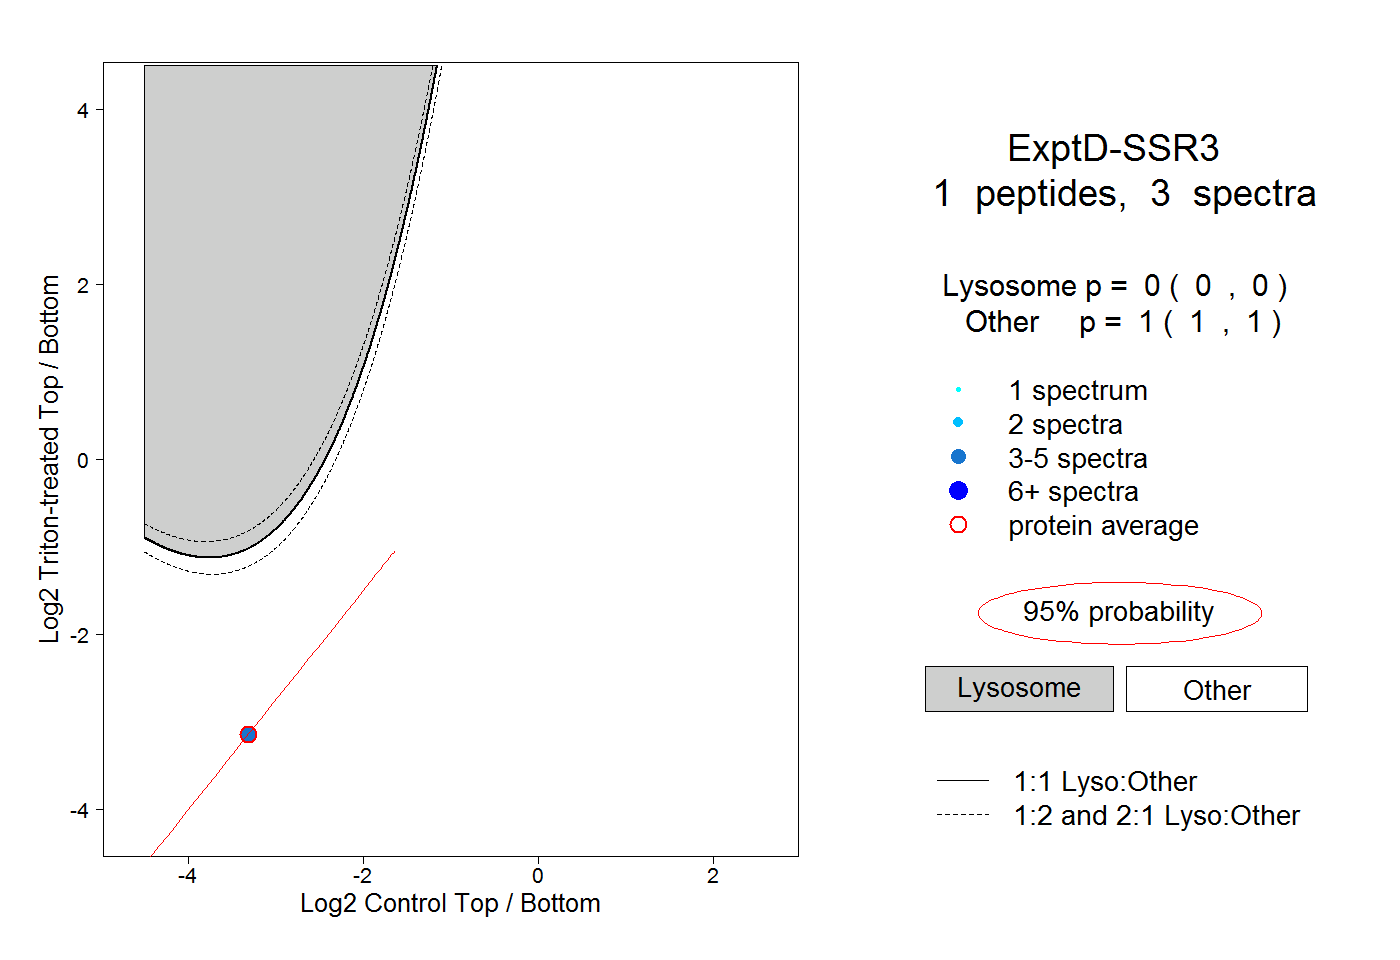
0.000 | 0.000
1.000 | 1.000