 4
4peptides
spectra
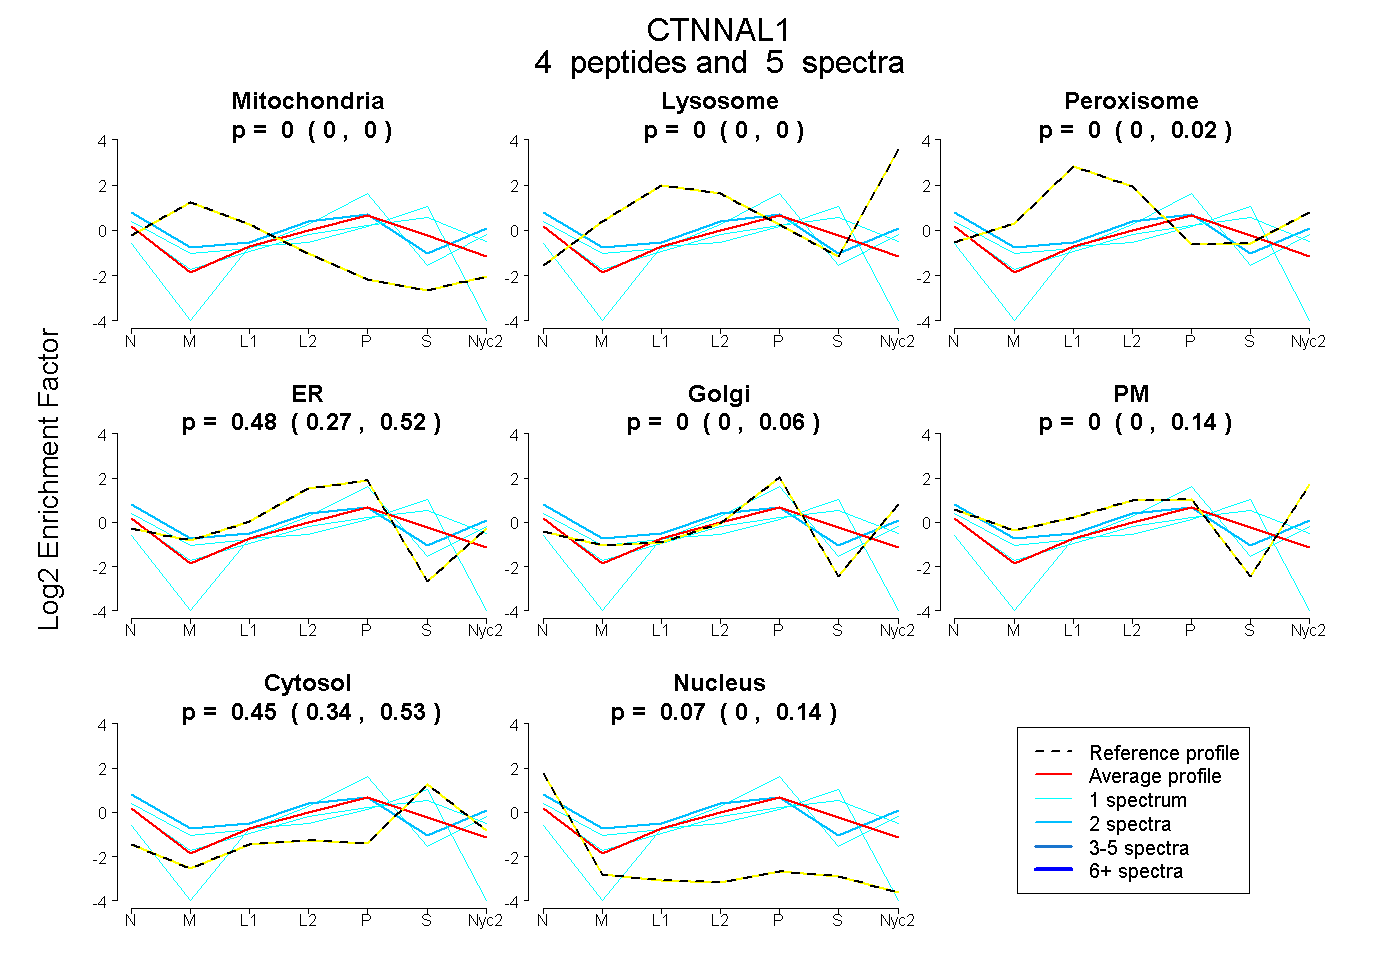
0.000 | 0.000
0.000 | 0.000
0.000 | 0.022
0.271 | 0.517
0.000 | 0.059
0.000 | 0.143
0.337 | 0.531
0.000 | 0.140
| Plot | Mito | Lyso | Perox | ER | Golgi | PM | Cytosol | Nucleus | |||||
| Expt A |
4 peptides |
5 spectra |
|
0.000 0.000 | 0.000 |
0.000 0.000 | 0.000 |
0.000 0.000 | 0.022 |
0.479 0.271 | 0.517 |
0.000 0.000 | 0.059 |
0.000 0.000 | 0.143 |
0.450 0.337 | 0.531 |
0.071 0.000 | 0.140 |
| 1 spectrum, EGVFDR | 0.000 | 0.000 | 0.000 | 0.361 | 0.362 | 0.091 | 0.123 | 0.063 | ||
| 1 spectrum, SAAEELELTVLK | 0.000 | 0.000 | 0.000 | 0.115 | 0.000 | 0.000 | 0.710 | 0.175 | ||
| 1 spectrum, VLLLADQVVIK | 0.000 | 0.000 | 0.000 | 0.195 | 0.000 | 0.185 | 0.620 | 0.000 | ||
| 2 spectra, EISDVFEGR | 0.000 | 0.000 | 0.025 | 0.169 | 0.000 | 0.510 | 0.217 | 0.079 |
| Plot | Lyso | Other | |||||||||||
| Expt C |
2 peptides |
2 spectra |
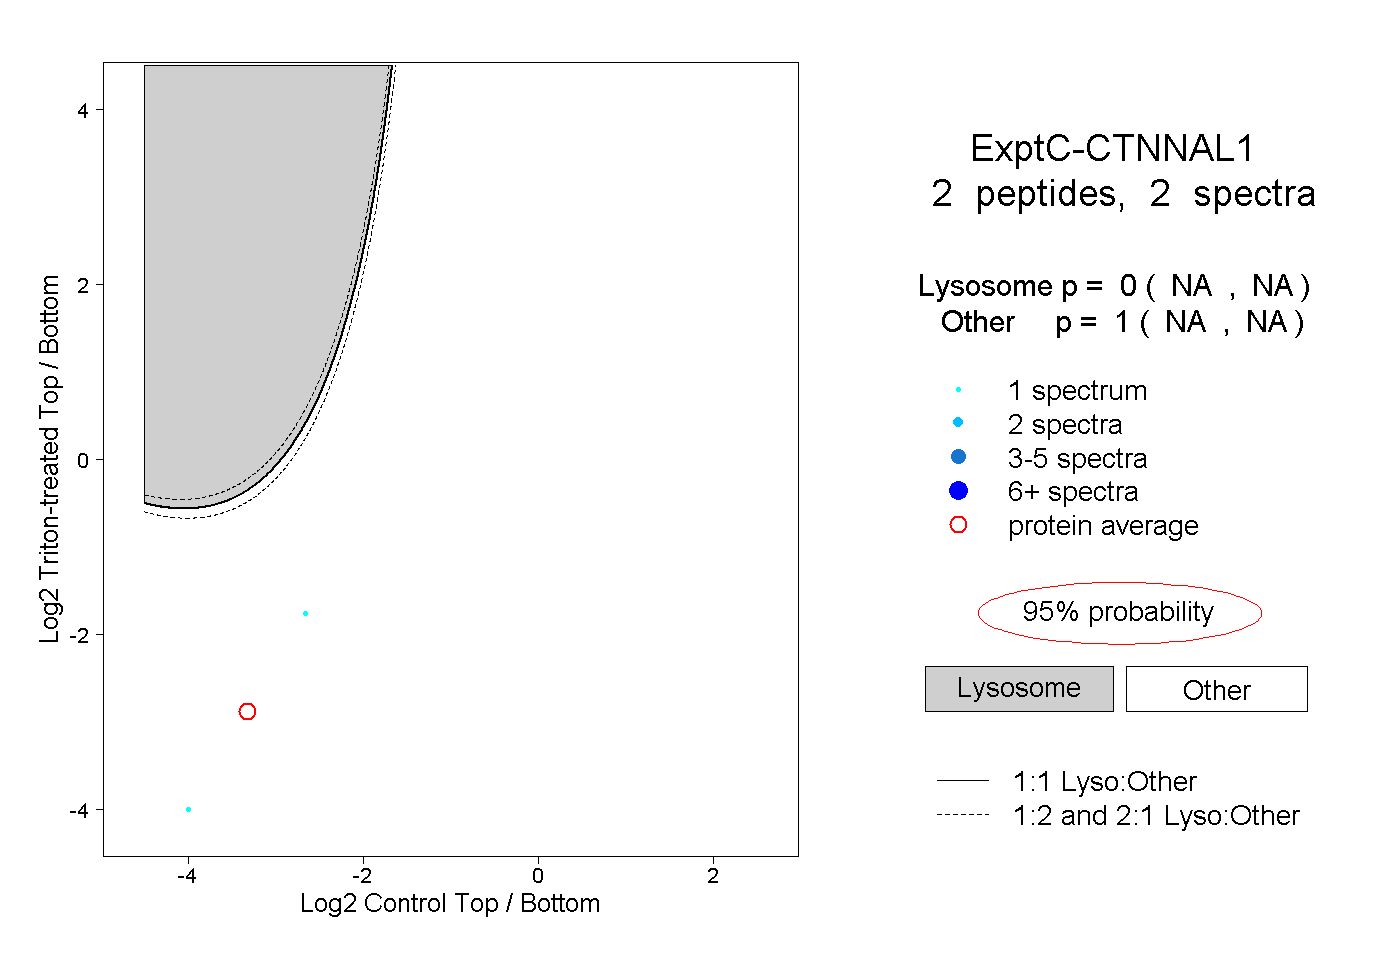 |
0.000 NA | NA |
1.000 NA | NA |