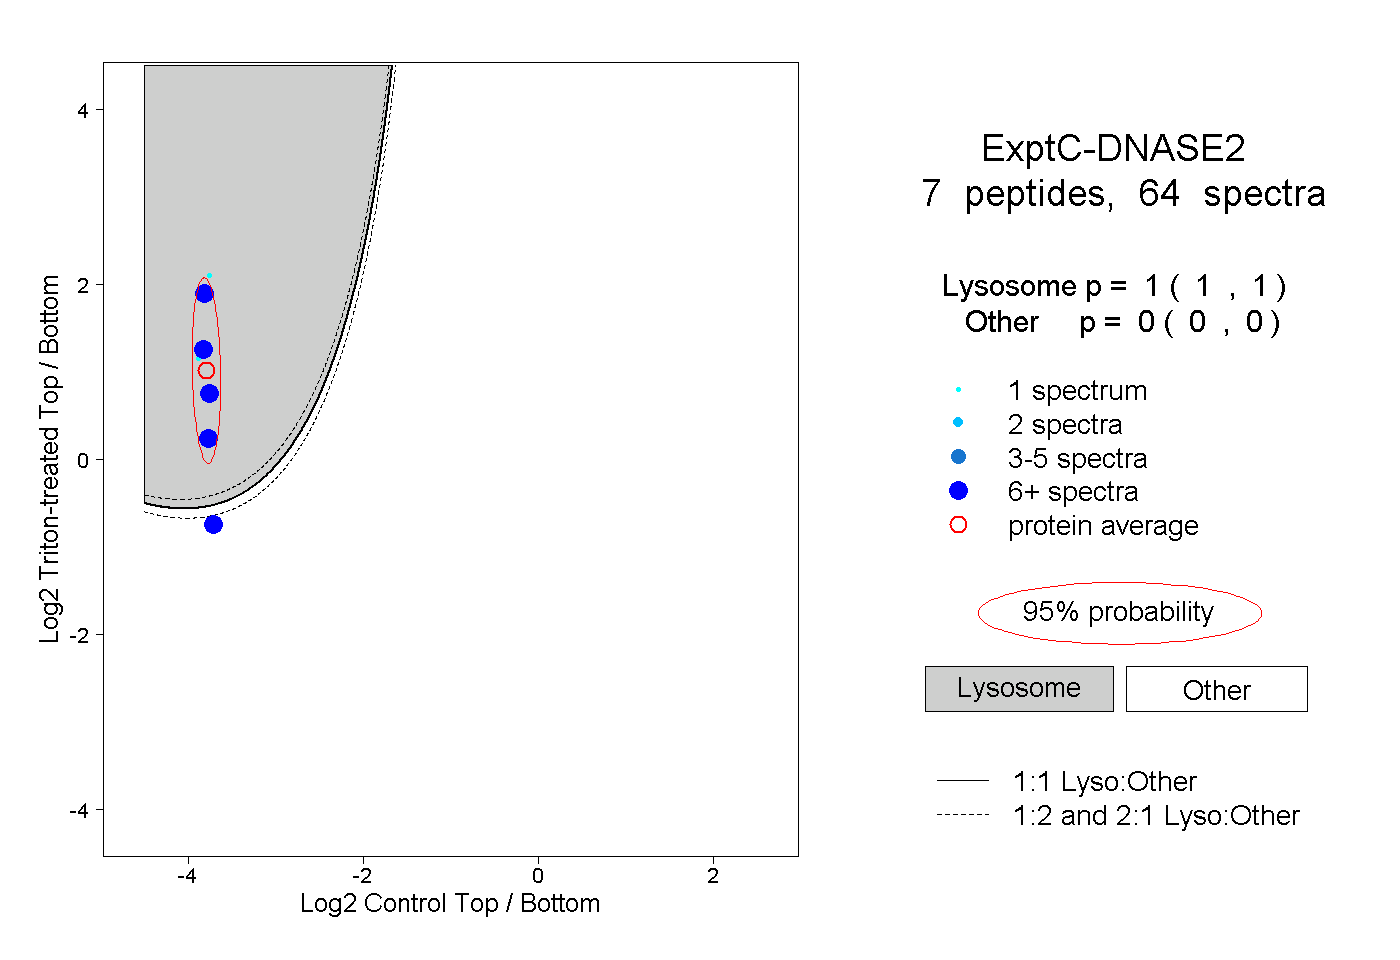
8
8peptides
spectra
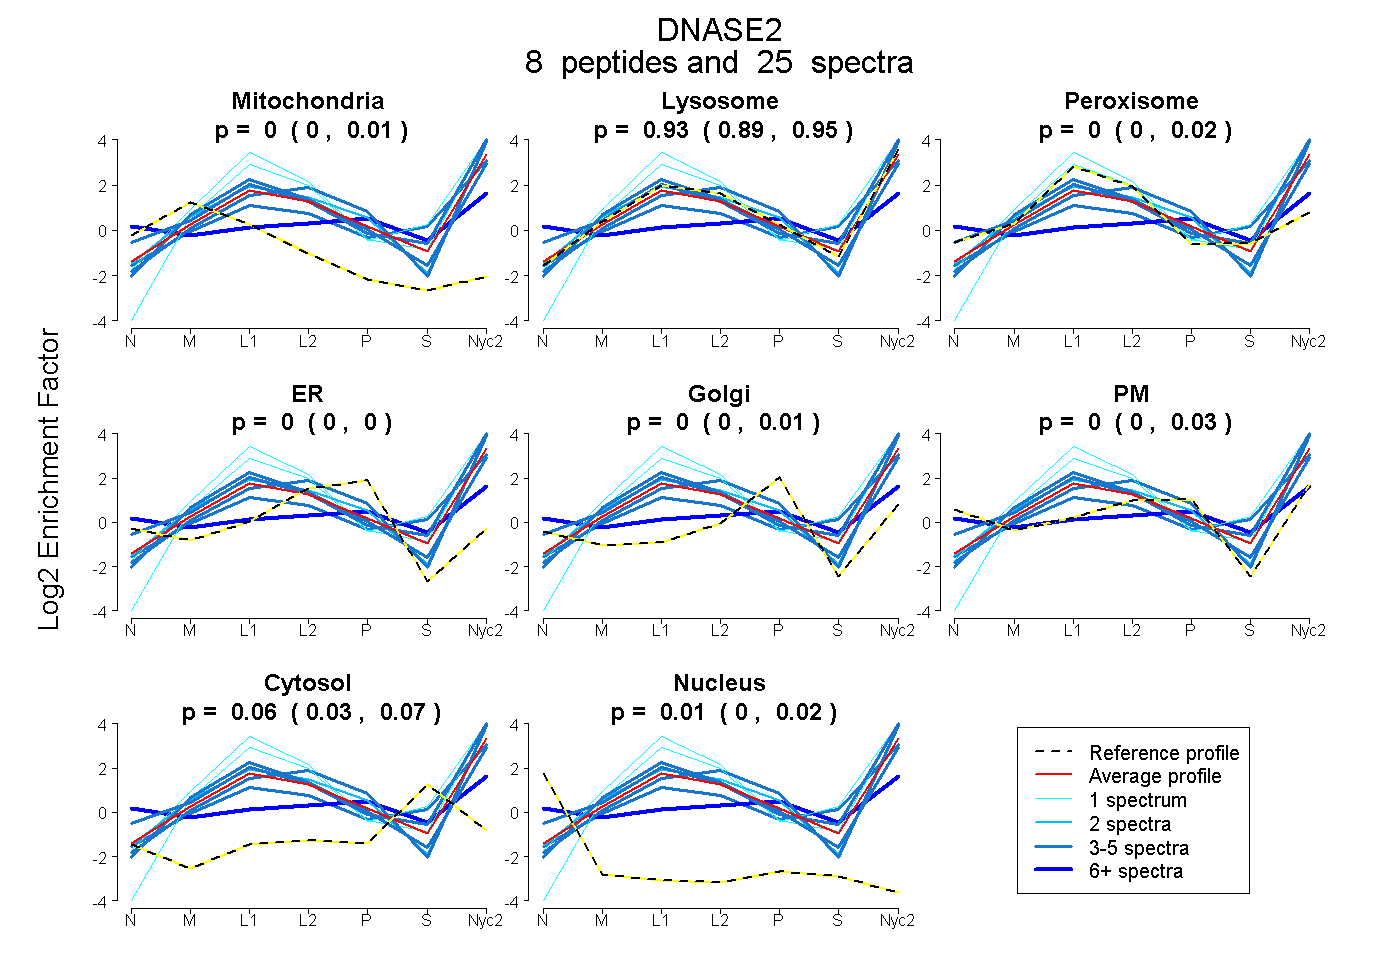
0.000 | 0.007
0.893 | 0.947
0.000 | 0.017
0.000 | 0.000
0.000 | 0.008
0.000 | 0.034
0.032 | 0.074
0.000 | 0.019
6peptides
spectra
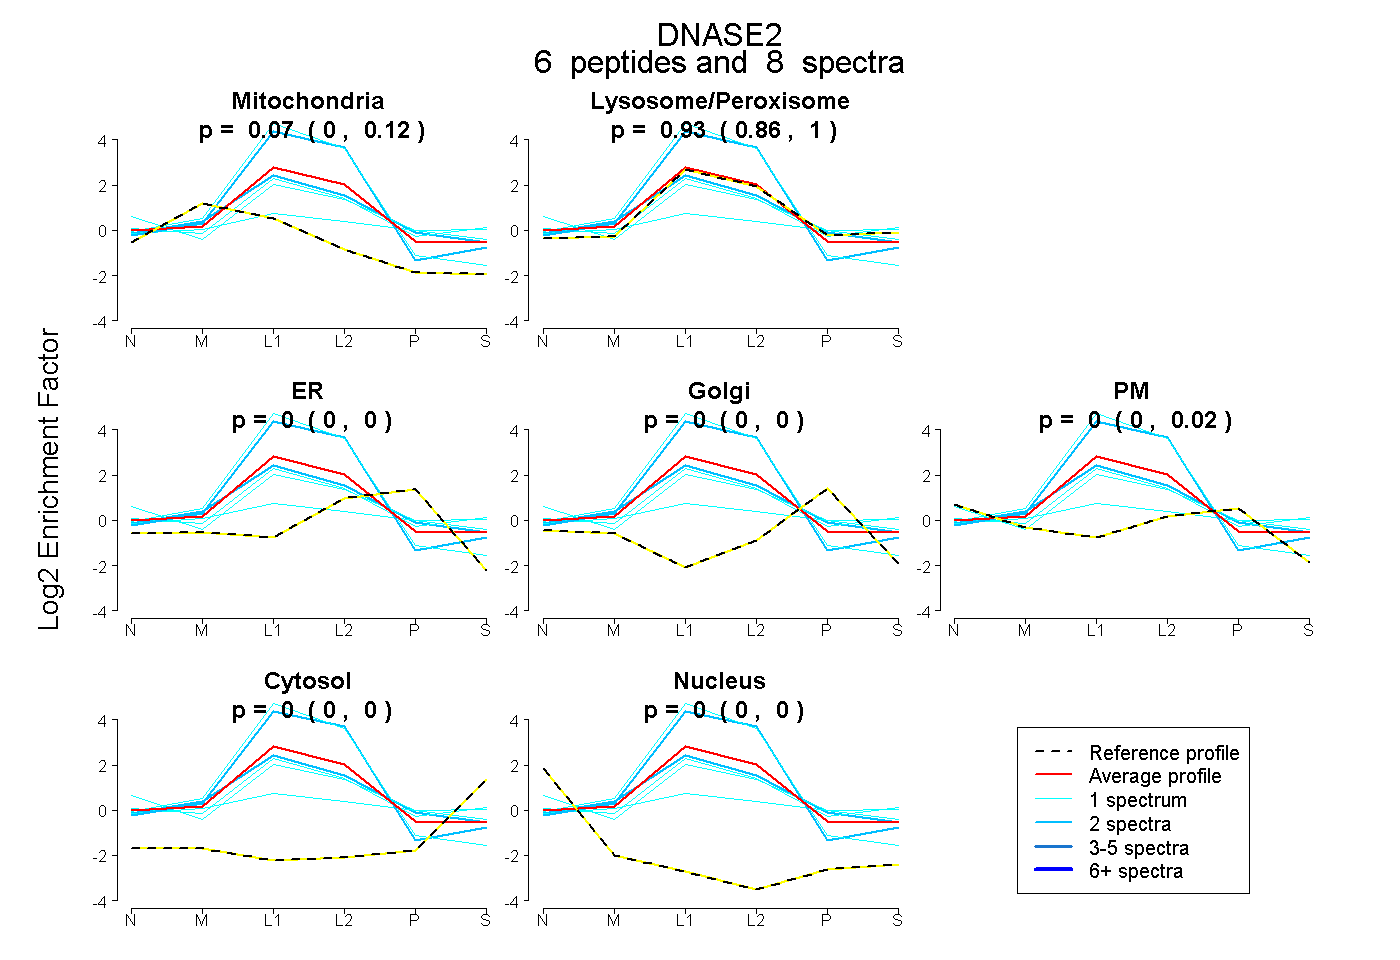
0.000 | 0.121
0.858 | 0.995
0.000 | 0.000
0.000 | 0.000
0.000 | 0.021
0.000 | 0.000
0.000 | 0.000