 8
8peptides
spectra
0.000 | 0.007
0.893 | 0.947
0.000 | 0.017
0.000 | 0.000
0.000 | 0.008
0.000 | 0.034
0.032 | 0.074
0.000 | 0.019
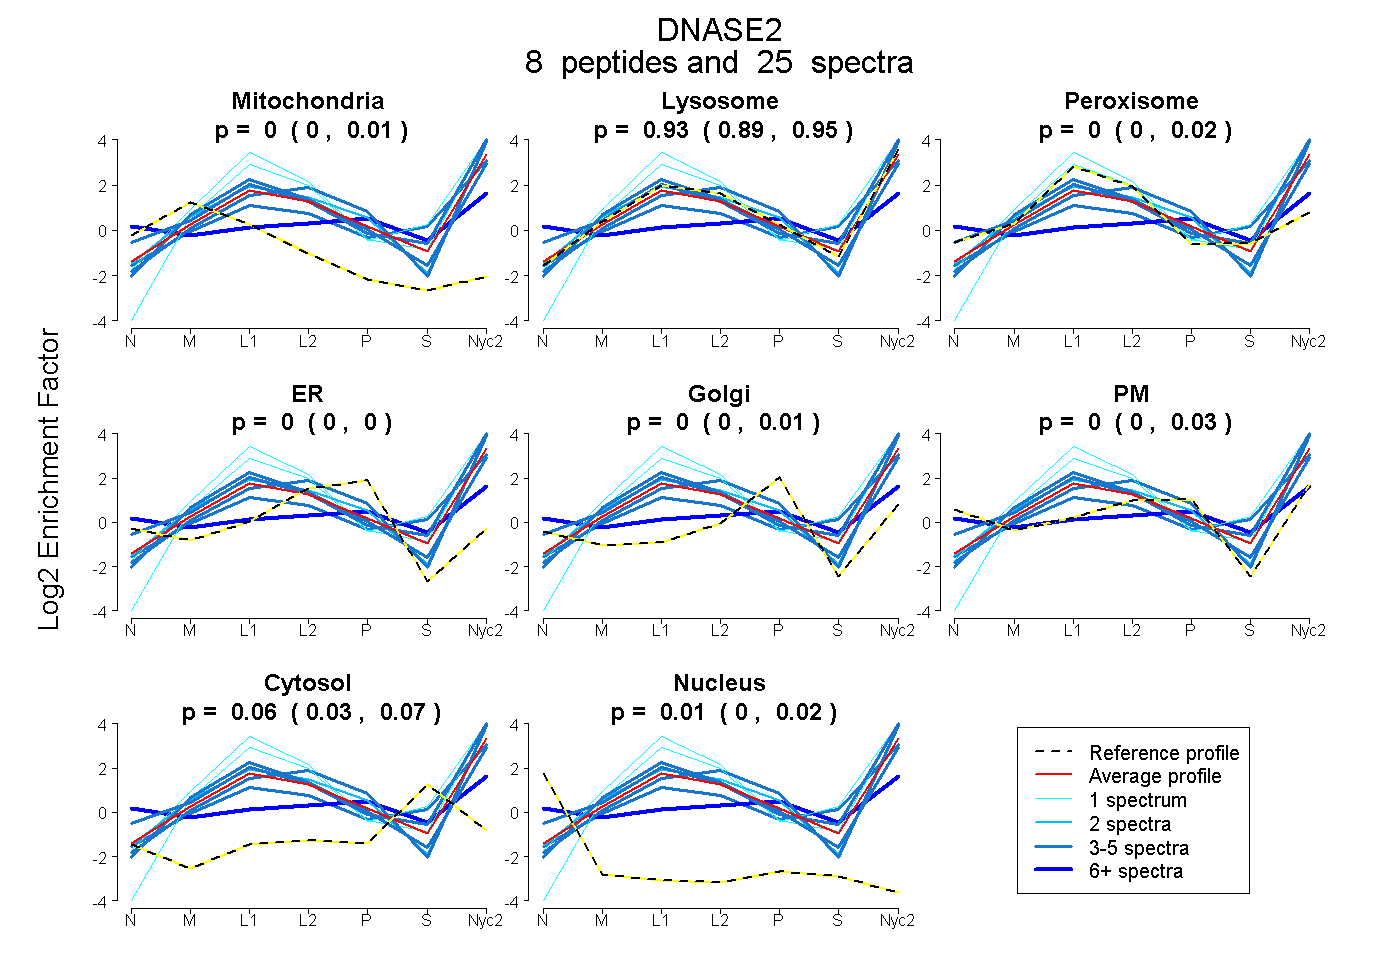
| Plot | Mito | Lyso | Perox | ER | Golgi | PM | Cytosol | Nucleus | |||||
| Expt A |
8 peptides |
25 spectra |
|
0.000 0.000 | 0.007 |
0.934 0.893 | 0.947 |
0.000 0.000 | 0.017 |
0.000 0.000 | 0.000 |
0.000 0.000 | 0.008 |
0.003 0.000 | 0.034 |
0.057 0.032 | 0.074 |
0.007 0.000 | 0.019 |
| 2 spectra, GVLLLDQEGGFWLVHSVPR | 0.000 | 0.940 | 0.000 | 0.000 | 0.000 | 0.060 | 0.000 | 0.000 | ||
| 4 spectra, WCVAPEGPWVCVGDMNR | 0.087 | 0.913 | 0.000 | 0.000 | 0.000 | 0.000 | 0.000 | 0.000 | ||
| 4 spectra, QLTYTYPLVYDHK | 0.000 | 0.971 | 0.017 | 0.000 | 0.000 | 0.000 | 0.002 | 0.009 | ||
| 3 spectra, AGTTFQSFAK | 0.000 | 0.771 | 0.000 | 0.000 | 0.000 | 0.000 | 0.229 | 0.000 | ||
| 1 spectrum, GGGTLCTQVPALWK | 0.000 | 0.936 | 0.064 | 0.000 | 0.000 | 0.000 | 0.000 | 0.000 | ||
| 4 spectra, LEGIFAQK | 0.000 | 0.924 | 0.000 | 0.000 | 0.076 | 0.000 | 0.000 | 0.000 | ||
| 6 spectra, FPSPASSGAYSWPPNAR | 0.000 | 0.209 | 0.024 | 0.000 | 0.000 | 0.513 | 0.253 | 0.000 | ||
| 1 spectrum, LPDLEEVTK | 0.000 | 1.000 | 0.000 | 0.000 | 0.000 | 0.000 | 0.000 | 0.000 |
| Plot | Mito | Lyso or Perox | ER | Golgi | PM | Cytosol | Nucleus | ||||||
| Expt B |
6 peptides |
8 spectra |
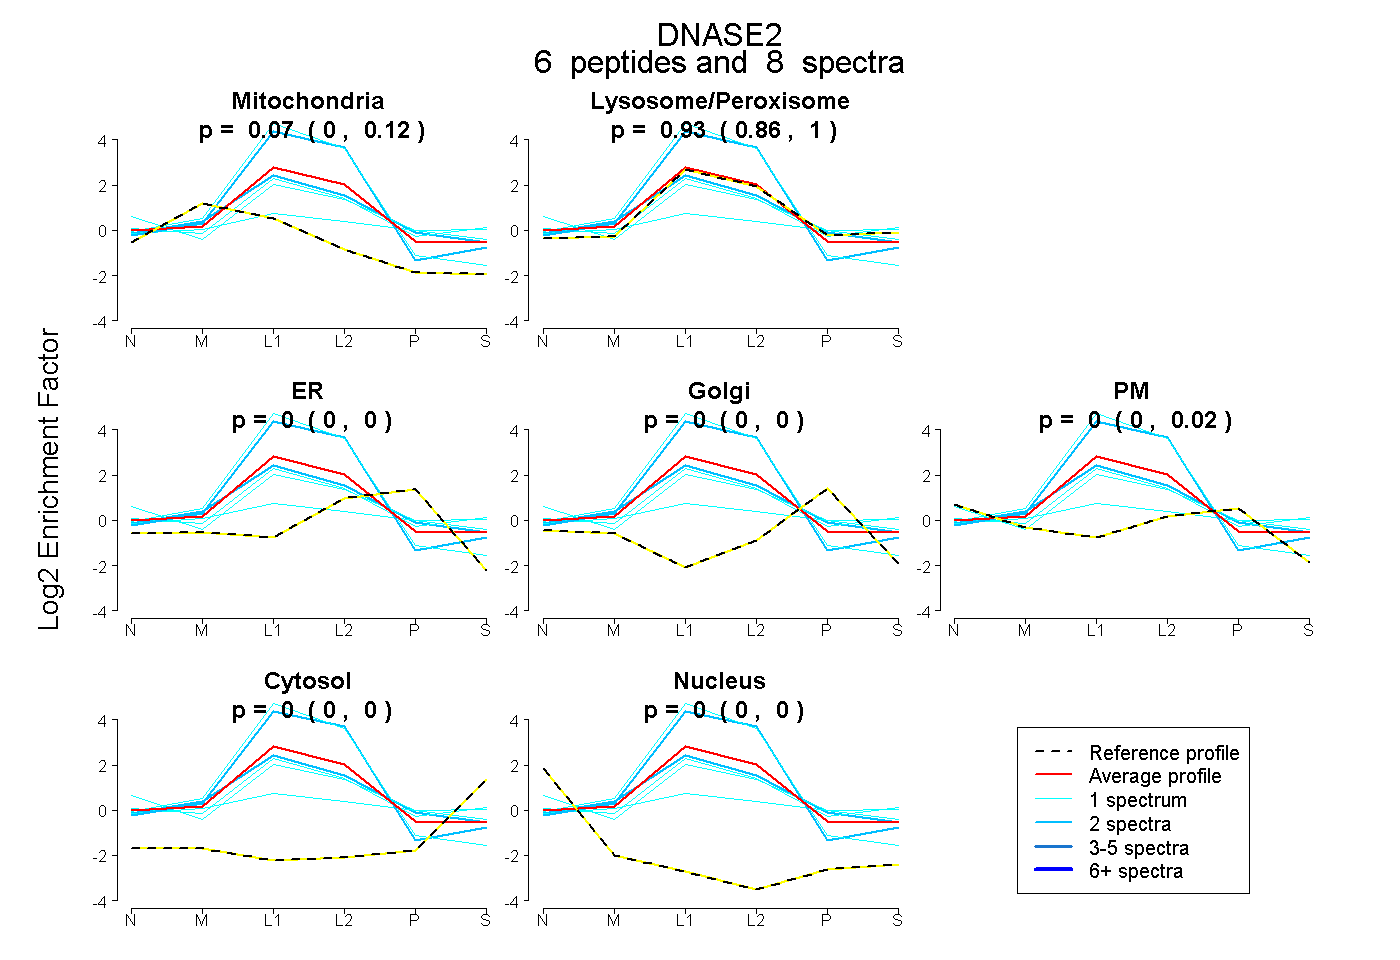 |
0.068 0.000 | 0.121 |
0.932 0.858 | 0.995 |
0.000 0.000 | 0.000 |
0.000 0.000 | 0.000 |
0.000 0.000 | 0.021 |
0.000 0.000 | 0.000 |
0.000 0.000 | 0.000 |
|||
| Plot | Lyso | Other | |||||||||||
| Expt C |
7 peptides |
64 spectra |
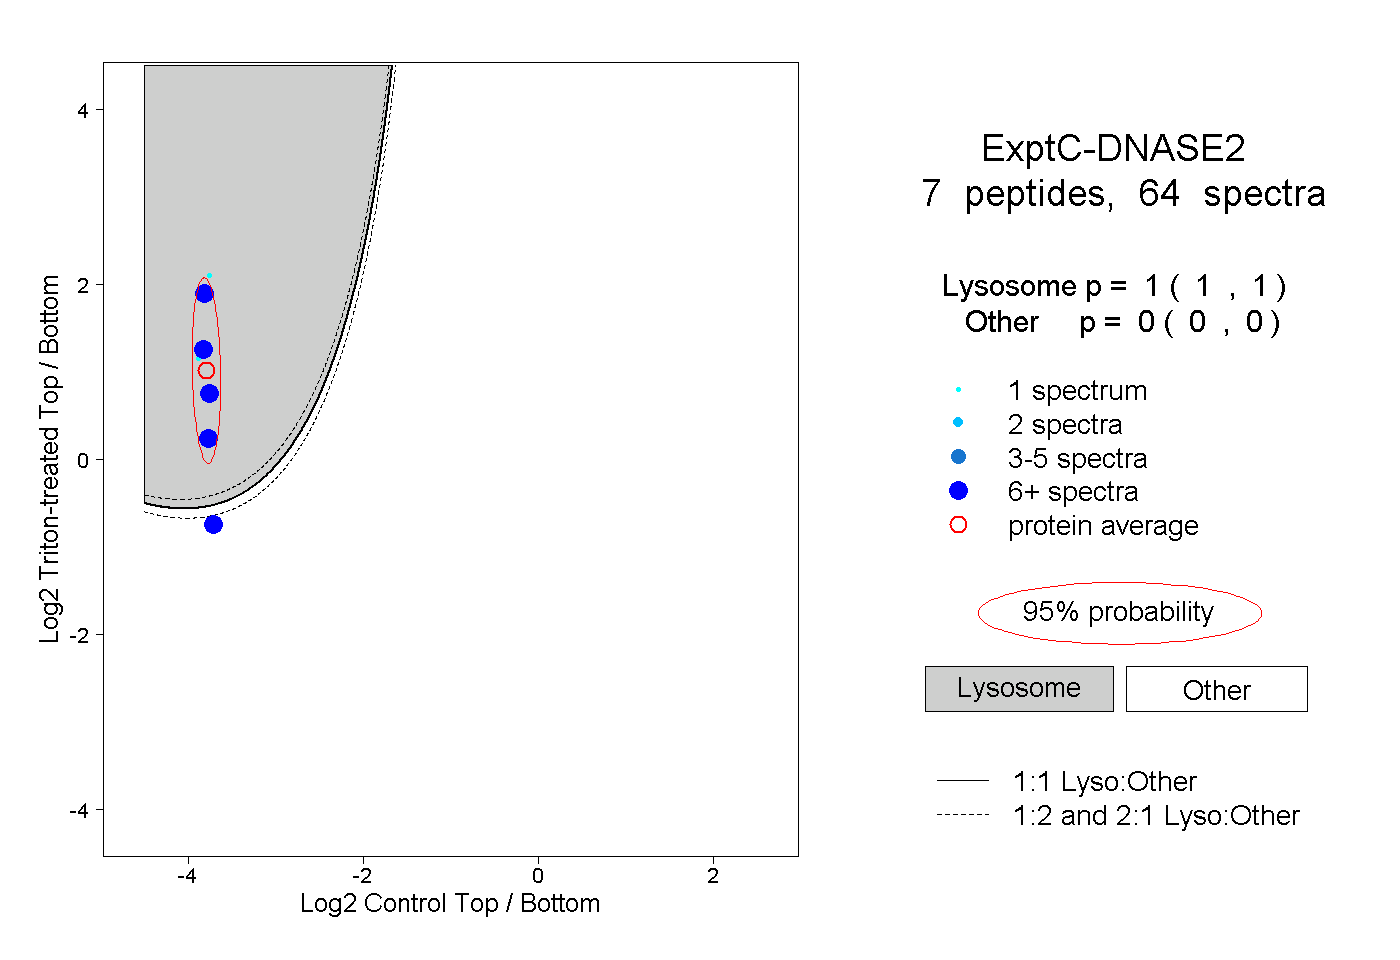 |
1.000 1.000 | 1.000 |
0.000 0.000 | 0.000 |
||||||||
| Plot | Lyso | Other | |||||||||||
| Expt D |
3 peptides |
6 spectra |
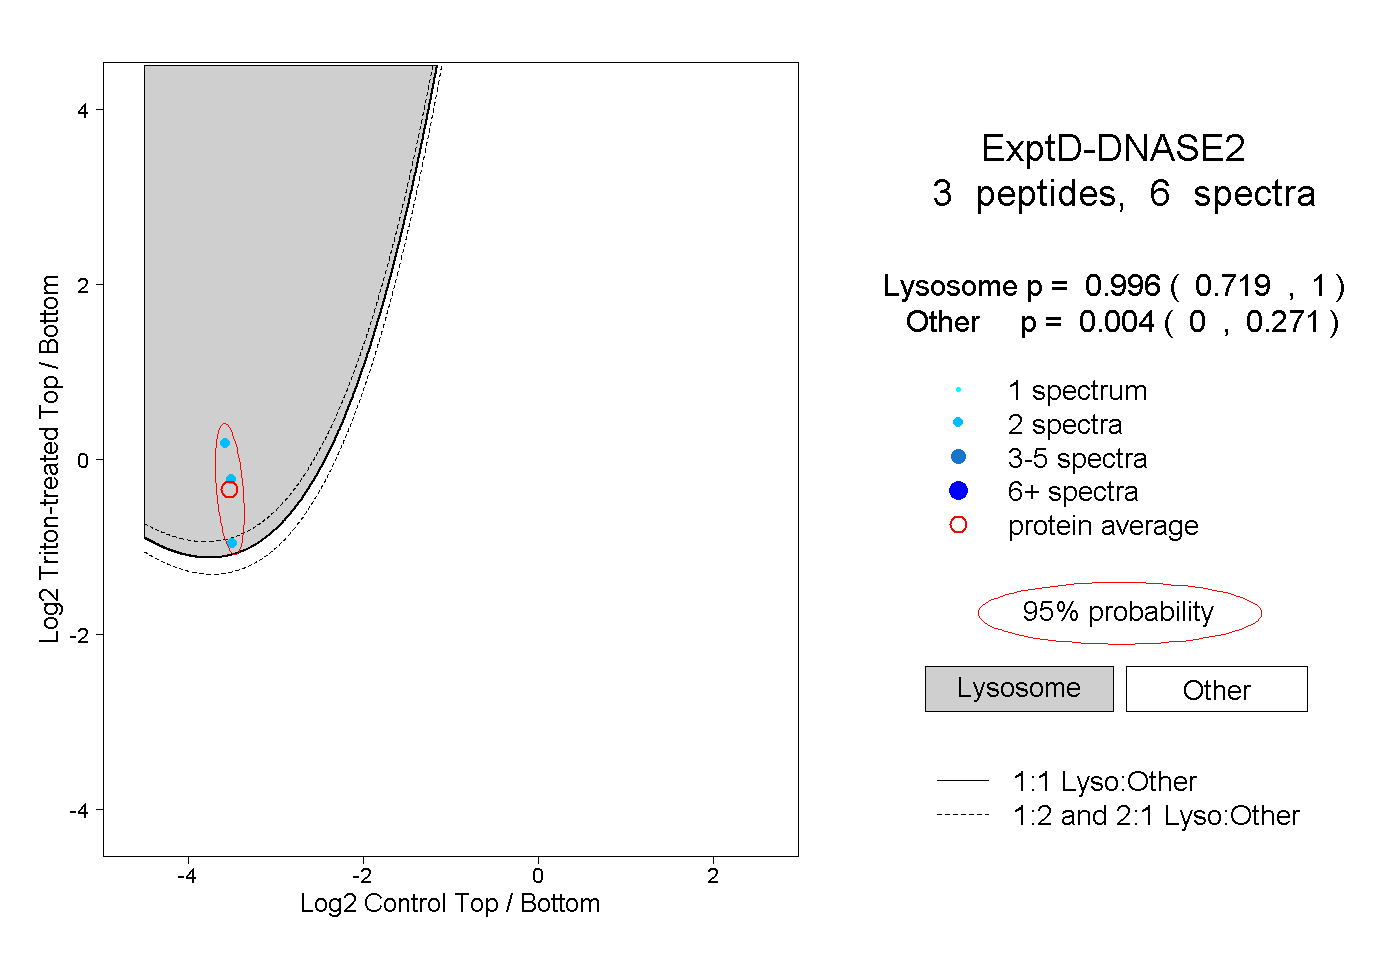 |
0.996 0.719 | 1.000 |
0.004 0.000 | 0.271 |