 11
11peptides
spectra
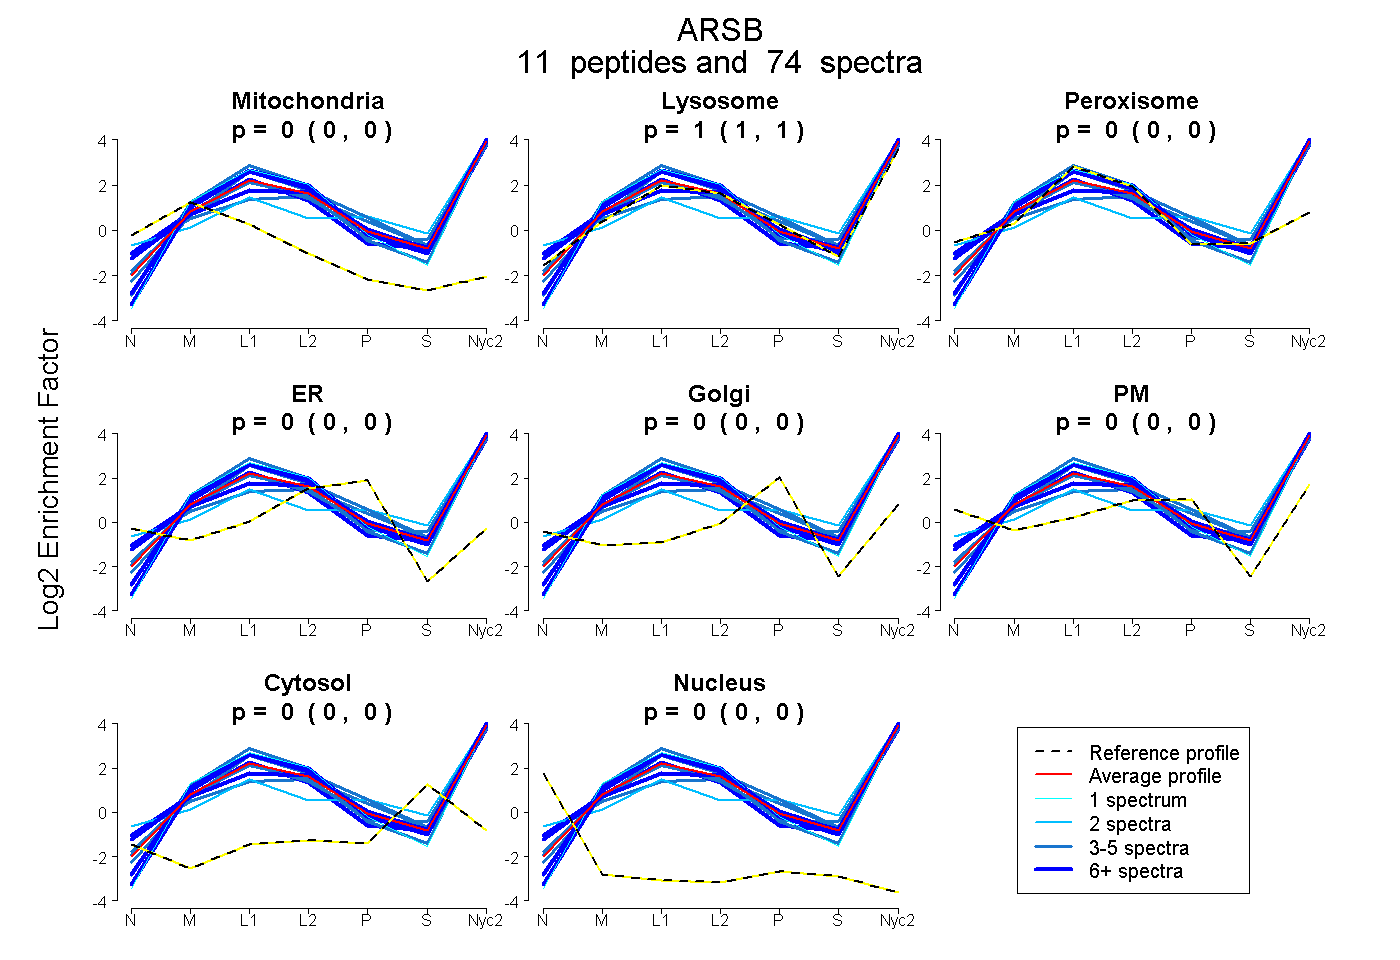
0.000 | 0.000
1.000 | 1.000
0.000 | 0.000
0.000 | 0.000
0.000 | 0.000
0.000 | 0.000
0.000 | 0.000
0.000 | 0.000
12peptides
spectra
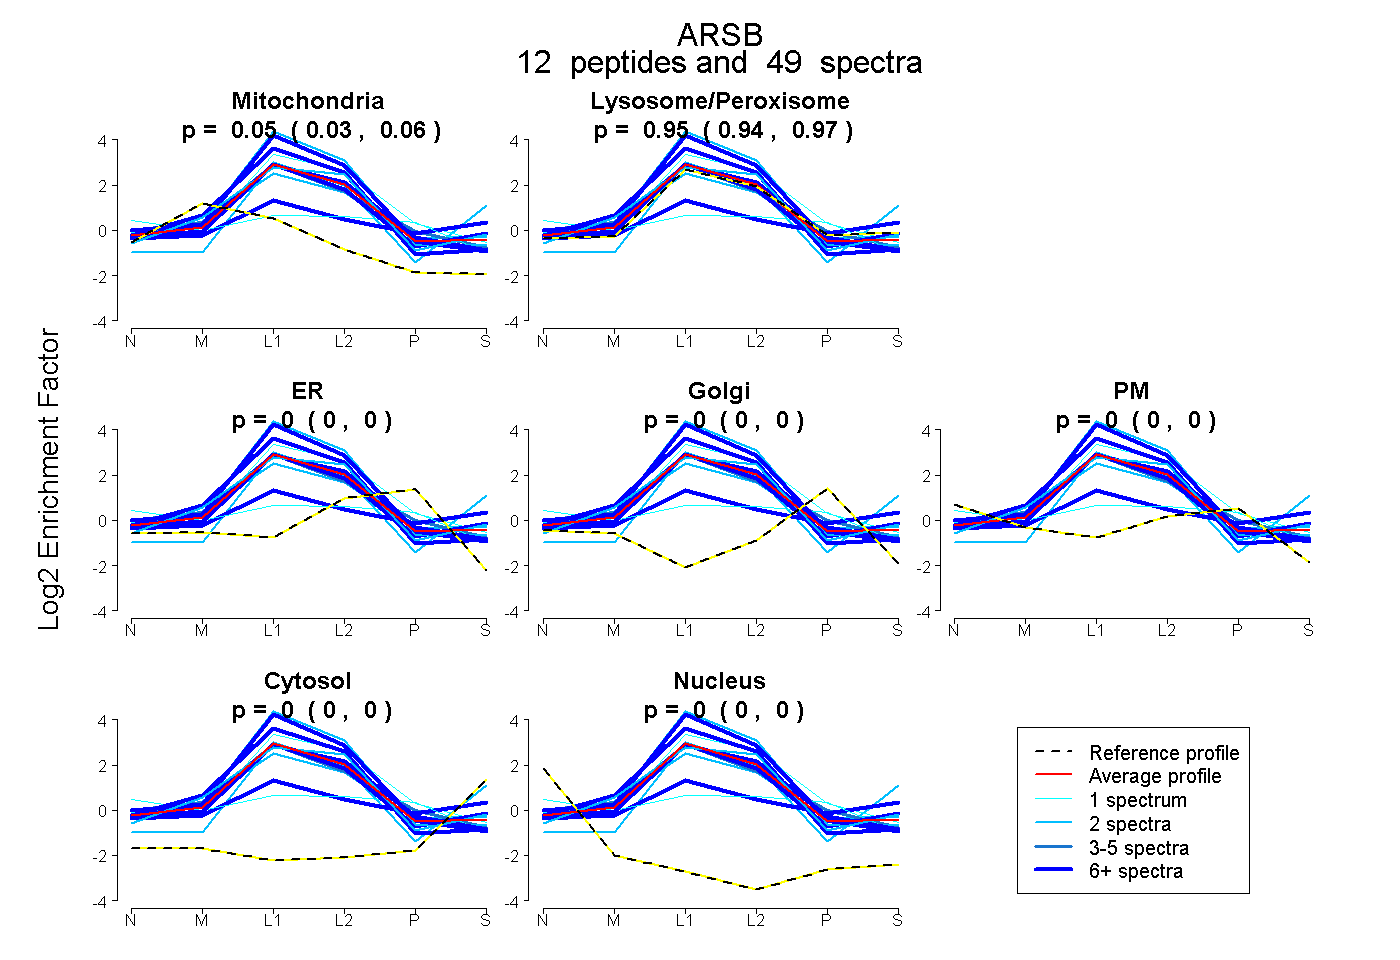
0.031 | 0.057
0.940 | 0.966
0.000 | 0.000
0.000 | 0.000
0.000 | 0.000
0.000 | 0.000
0.000 | 0.000
13peptides
spectra
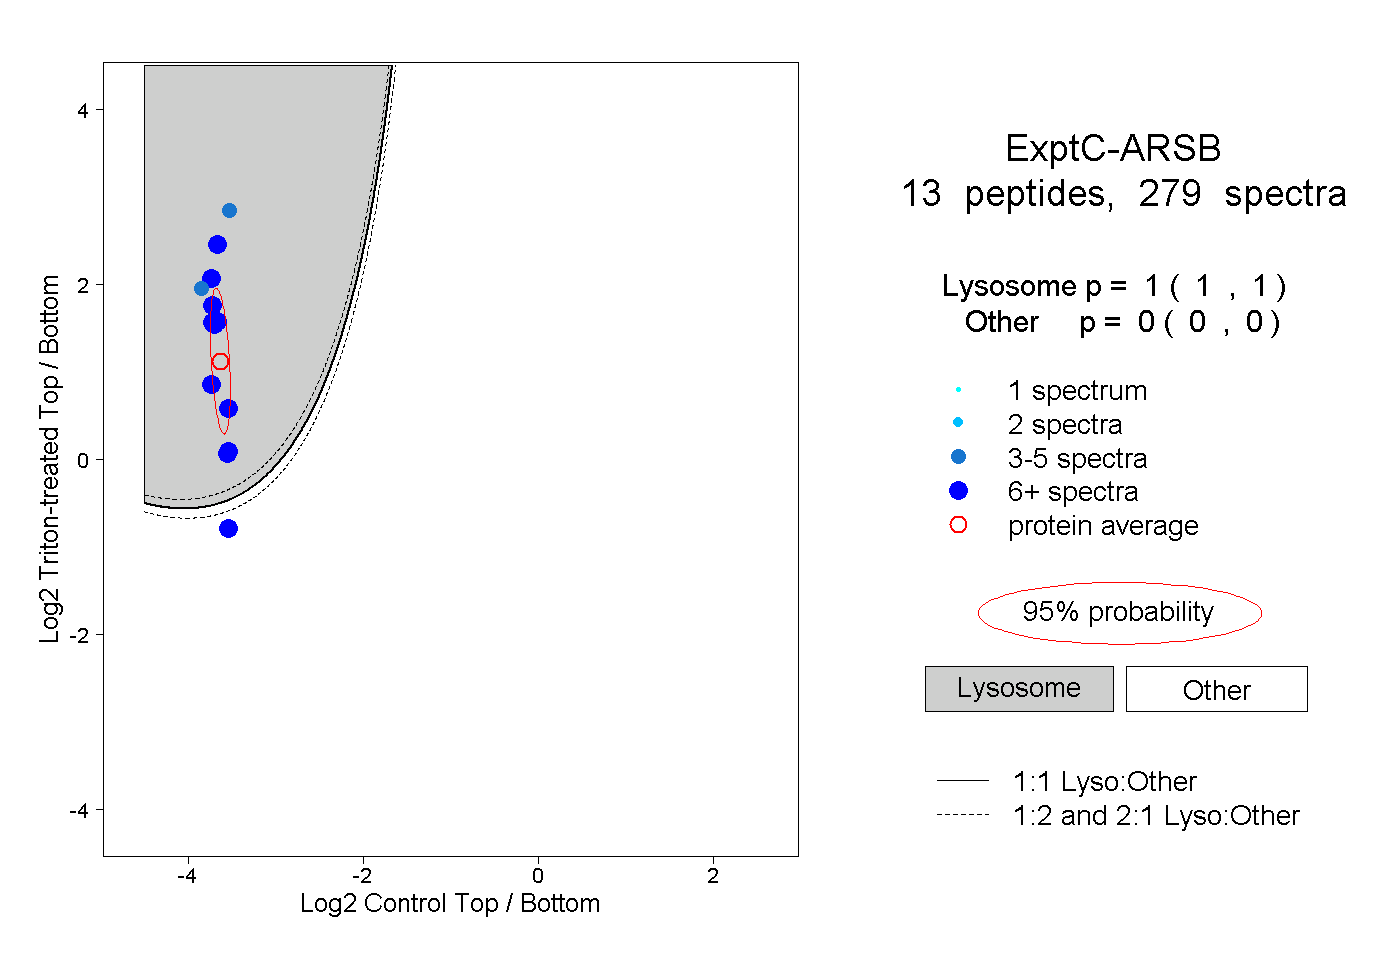
1.000 | 1.000
0.000 | 0.000
7peptides
spectra
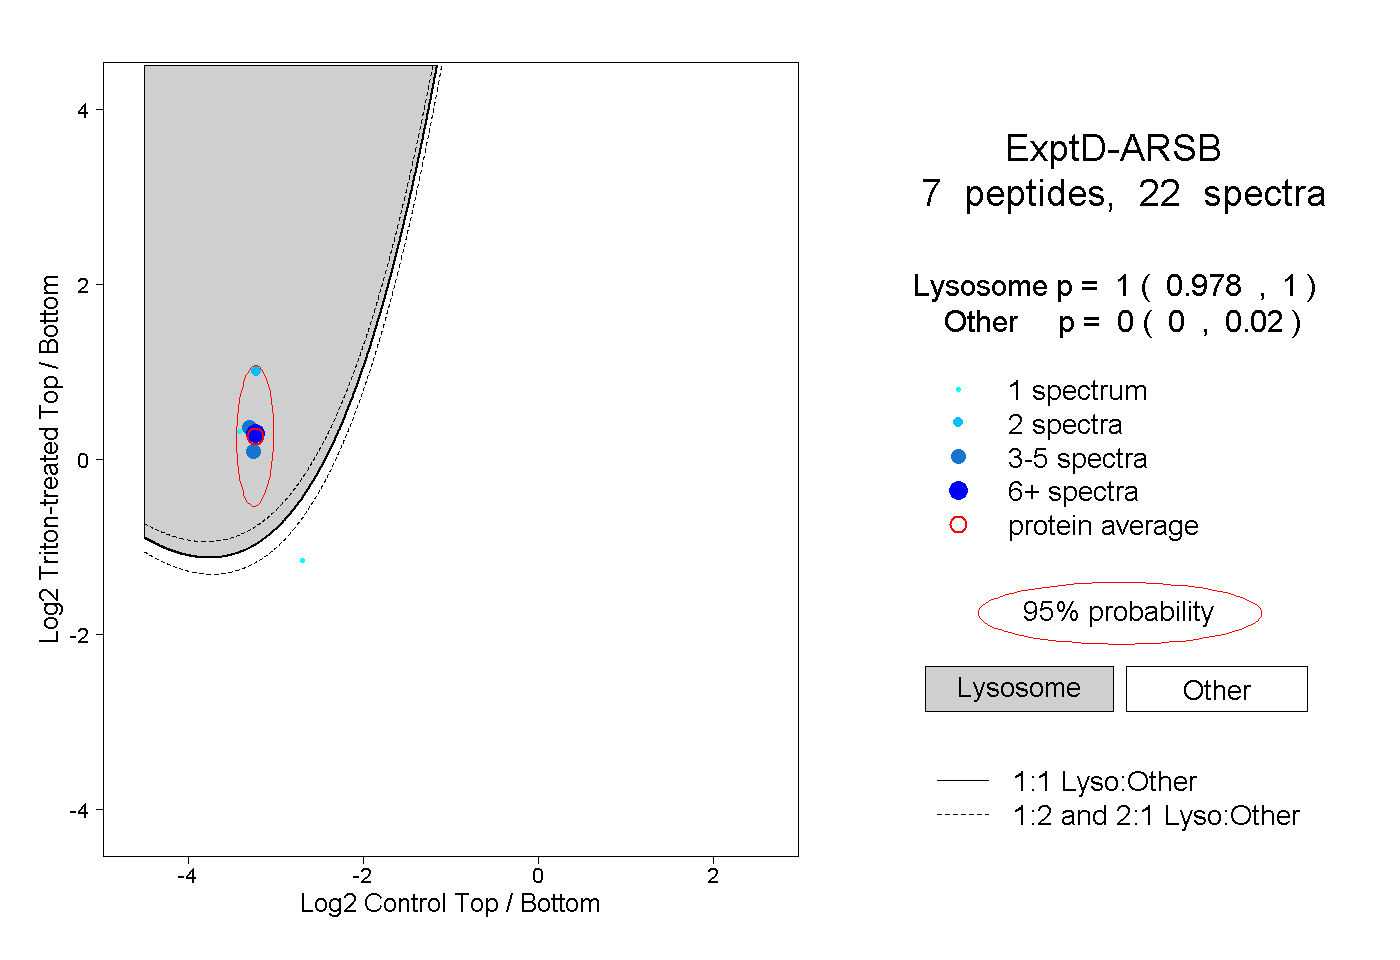
0.978 | 1.000
0.000 | 0.020