GCH1
[ENSRNOP00000014821]
Main page
| | | Plot |
Mito |
Lyso |
|
Perox |
ER |
Golgi |
PM |
Cytosol |
Nucleus |
|
| Expt A |
 10
10
peptides |
21
spectra |
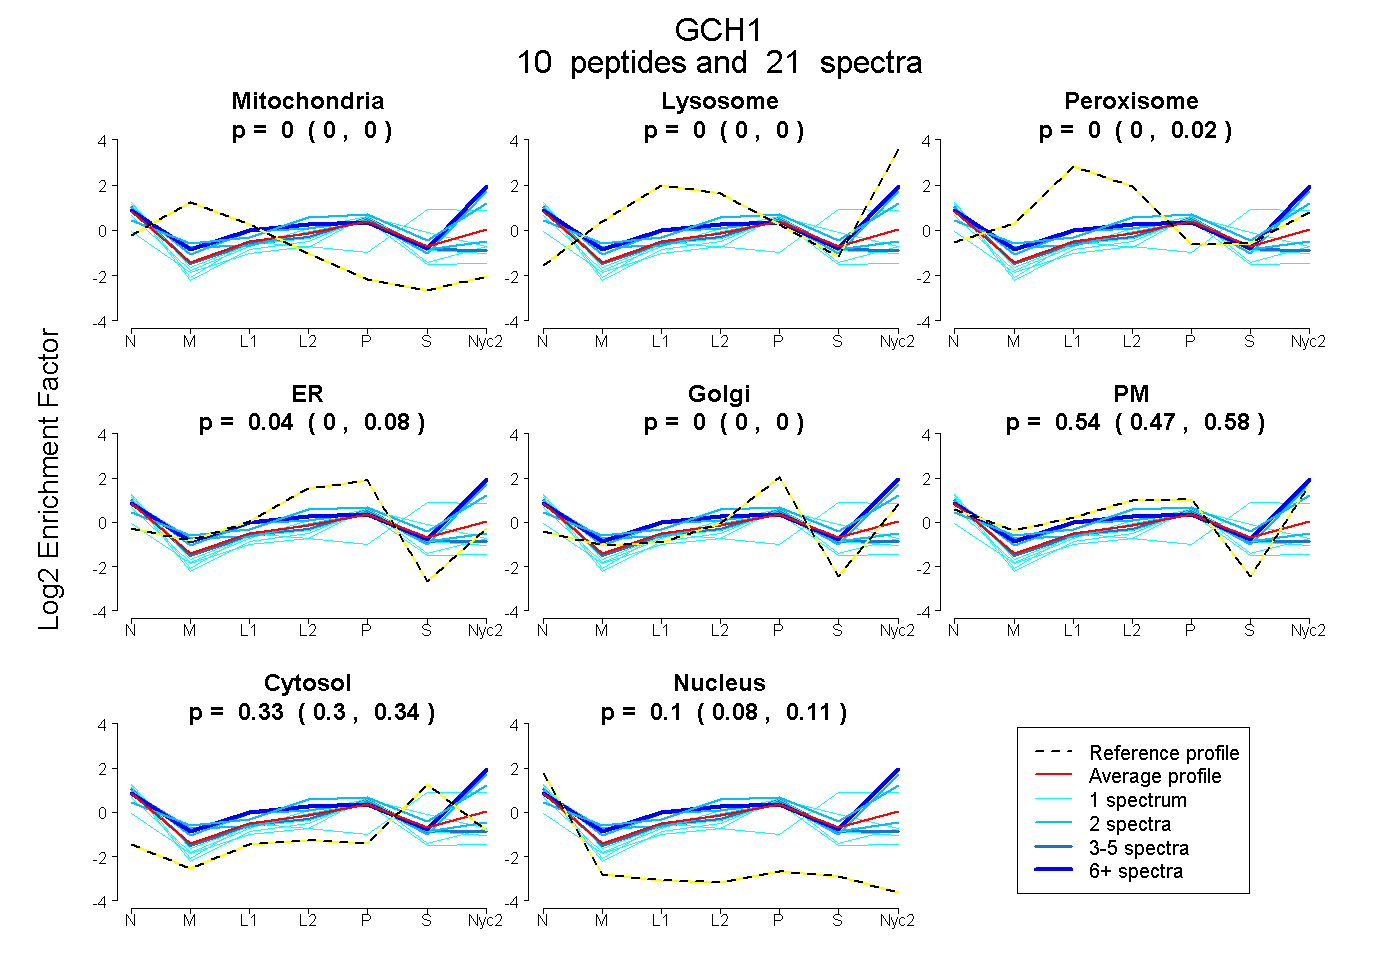 |
0.000
0.000 | 0.000 |
0.000
0.000 | 0.000 |
|
0.000
0.000 | 0.017 |
0.037
0.000 | 0.079 |
0.000
0.000 | 0.000 |
0.540
0.471 | 0.582 |
0.325
0.305 | 0.338 |
0.098
0.084 | 0.112 |
|
| | | Plot |
Mito |
|
Lyso or Perox |
|
ER |
Golgi |
PM |
Cytosol |
Nucleus |
|
| Expt B |
7
peptides |
10
spectra |
 |
0.000
0.000 | 0.000 |
|
0.135
0.090 | 0.171 |
|
0.000
0.000 | 0.000 |
0.000
0.000 | 0.000 |
0.708
0.652 | 0.757 |
0.088
0.054 | 0.119 |
0.070
0.035 | 0.098 |
|
| | | Plot |
|
Lyso |
|
|
|
|
|
|
|
Other |
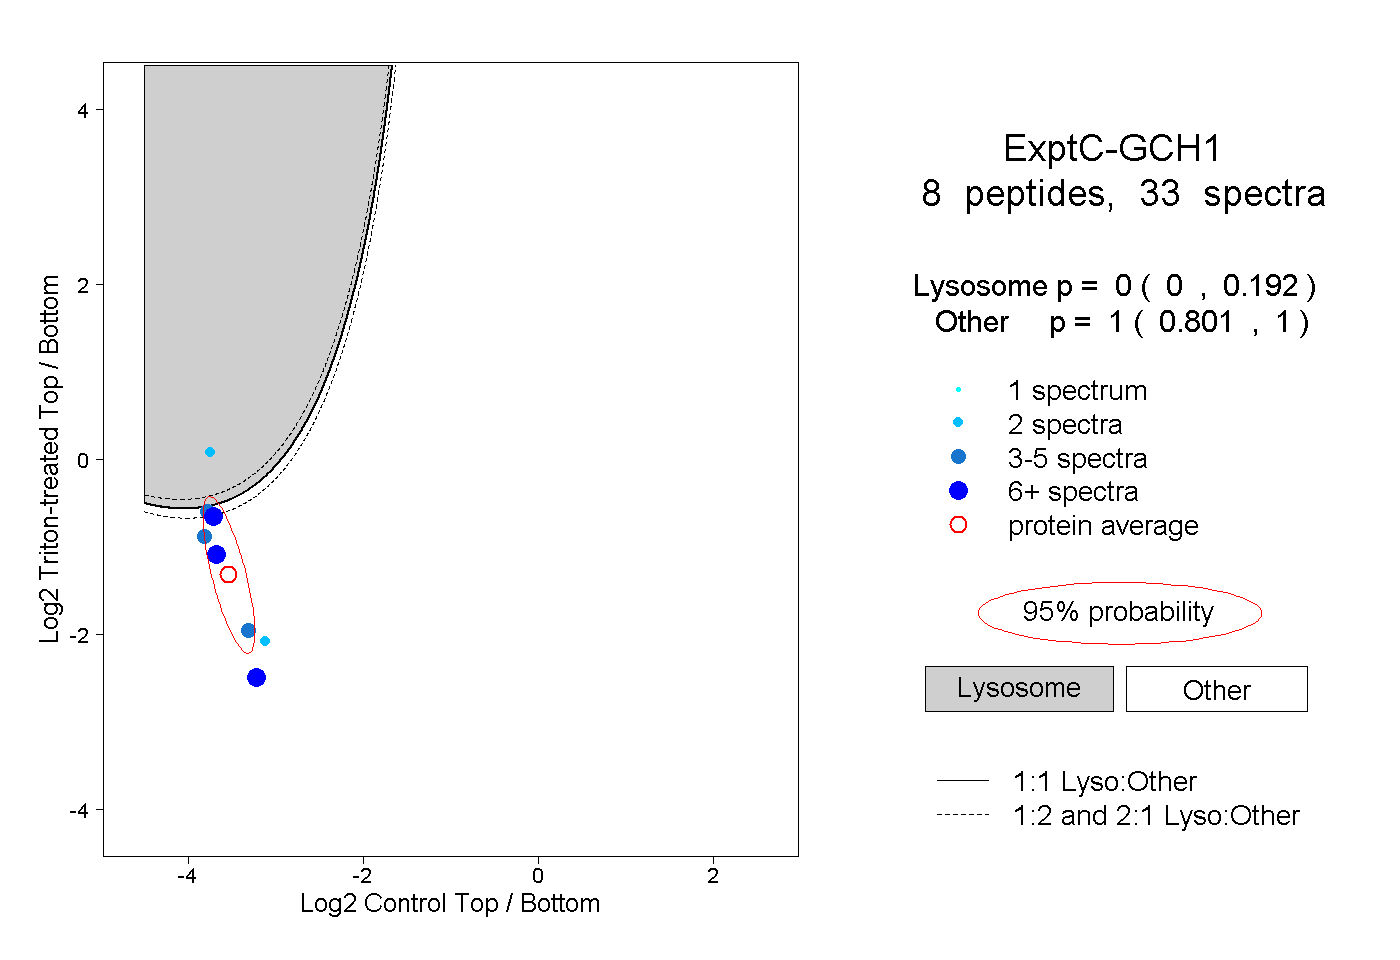
| Expt C |
8
peptides |
33
spectra |
 |
|
0.000
0.000 | 0.192 |
|
|
|
|
|
|
|
1.000
0.801 | 1.000 |
| 2 spectra, ELPRPGASRPAEK |
|
0.000 |
|
|
|
|
|
|
|
1.000 |
| 3 spectra, IVEIYSR |
|
0.329 |
|
|
|
|
|
|
|
0.671 |
| 6 spectra, SRPPEAK |
|
0.000 |
|
|
|
|
|
|
|
1.000 |
| 6 spectra, VHIGYLPNK |
|
0.001 |
|
|
|
|
|
|
|
0.999 |
| 6 spectra, TVTSTMLGVFR |
|
0.178 |
|
|
|
|
|
|
|
0.822 |
| 3 spectra, LQVQER |
|
0.017 |
|
|
|
|
|
|
|
0.983 |
| 2 spectra, EEFLTLIR |
|
0.999 |
|
|
|
|
|
|
|
0.001 |
| 5 spectra, AATAMQFFTK |
|
0.000 |
|
|
|
|
|
|
|
1.000 |
| | | Plot |
|
Lyso |
|
|
|
|
|
|
|
Other |
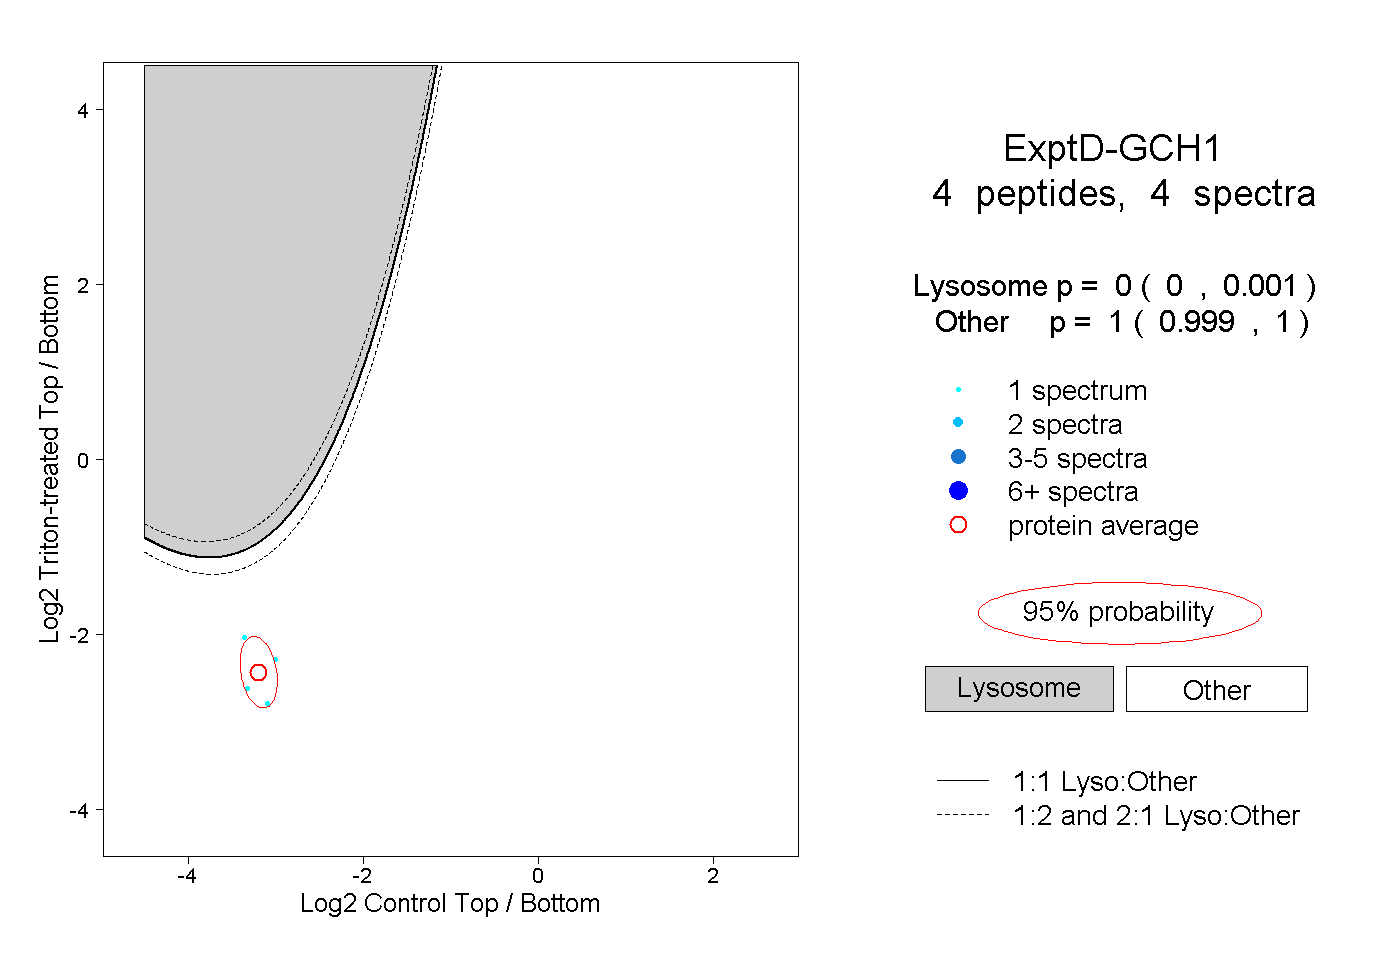
| Expt D |
4
peptides |
4
spectra |
 |
|
0.000
0.000 | 0.001 |
|
|
|
|
|
|
|
1.000
0.999 | 1.000 |