10
10peptides
spectra
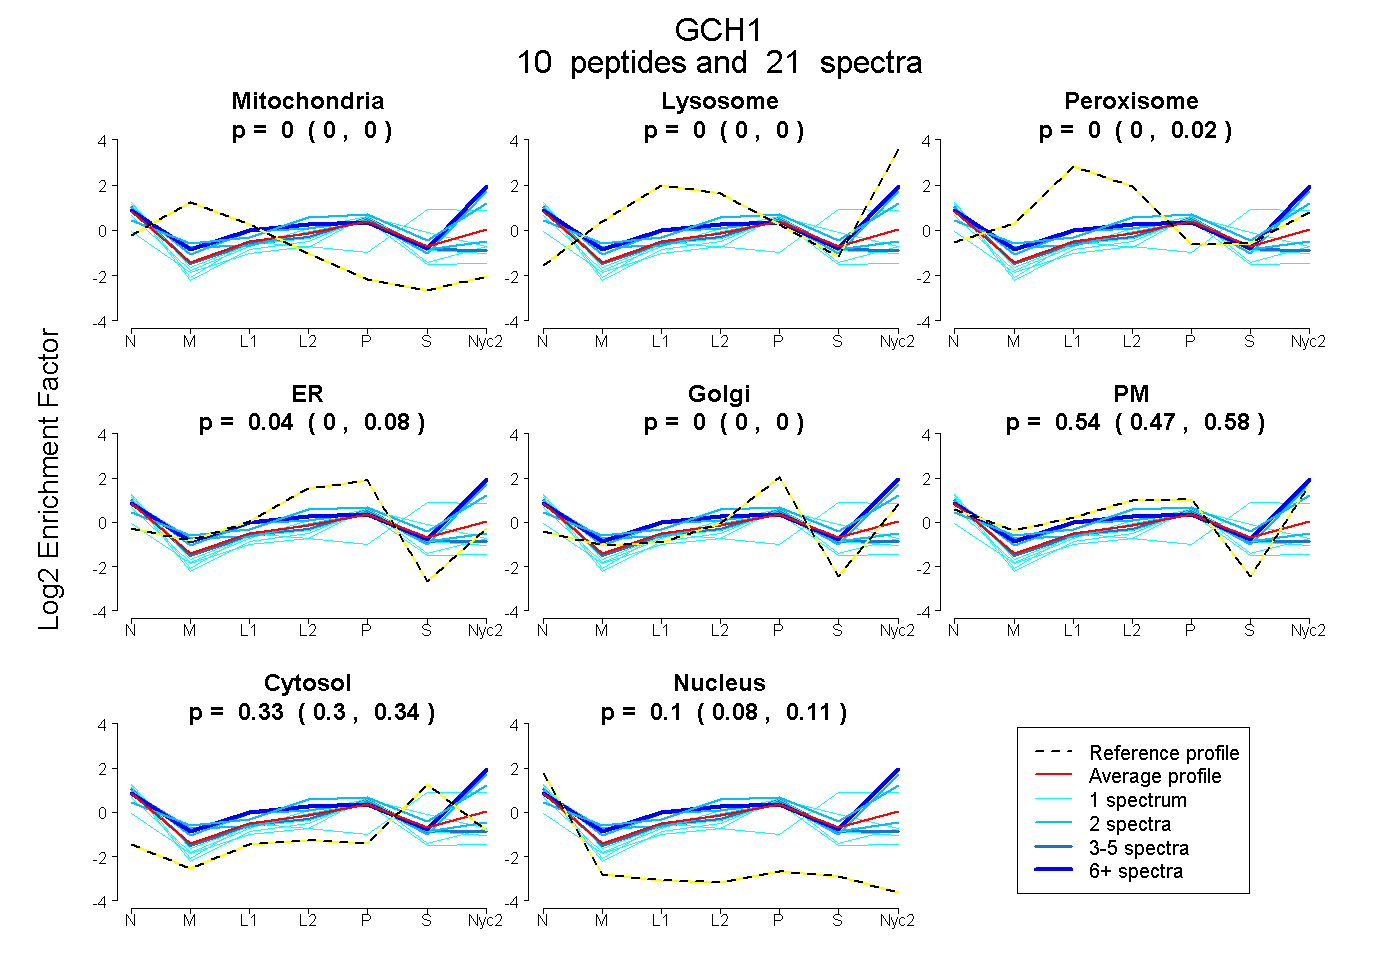
0.000 | 0.000
0.000 | 0.000
0.000 | 0.017
0.000 | 0.079
0.000 | 0.000
0.471 | 0.582
0.305 | 0.338
0.084 | 0.112
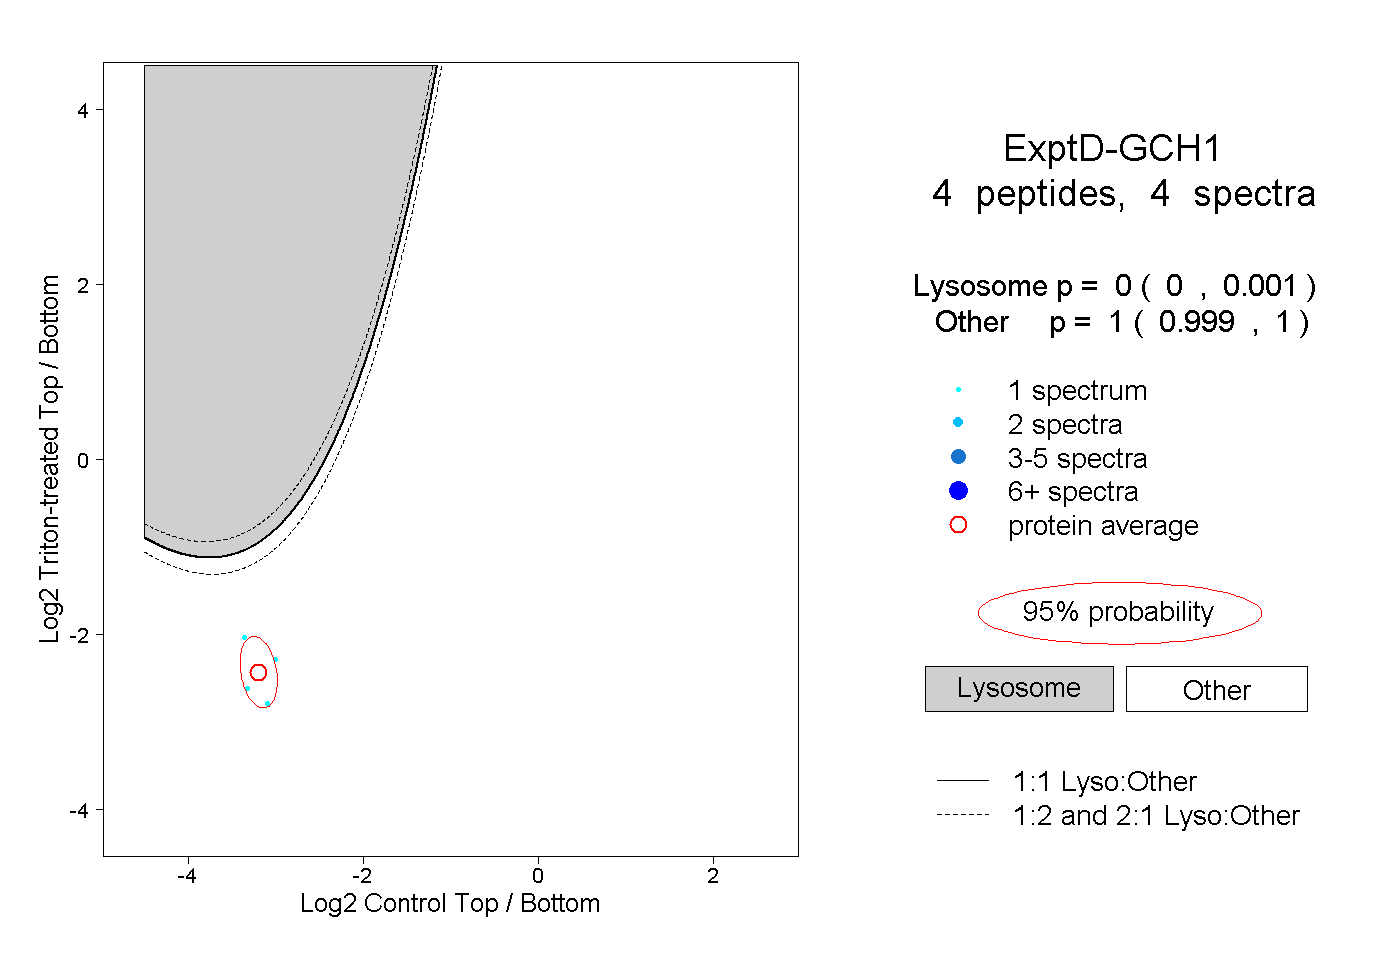
7peptides
spectra

0.000 | 0.000
0.090 | 0.171
0.000 | 0.000
0.000 | 0.000
0.652 | 0.757
0.054 | 0.119
0.035 | 0.098