15
15peptides
spectra
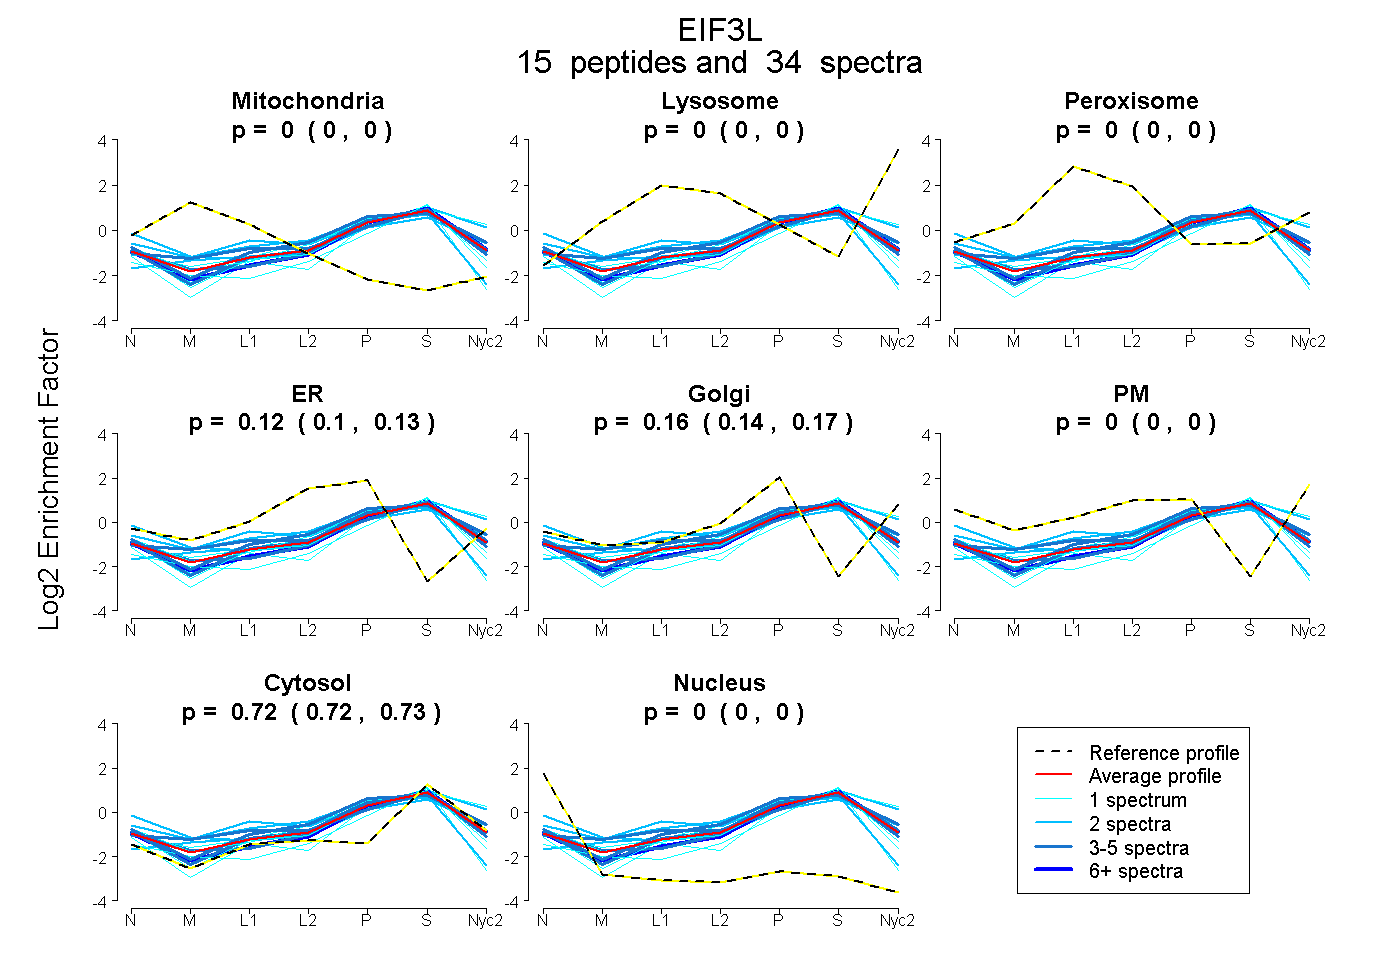
0.000 | 0.000
0.000 | 0.000
0.000 | 0.000
0.103 | 0.134
0.138 | 0.173
0.000 | 0.000
0.719 | 0.727
0.000 | 0.000
7peptides
spectra
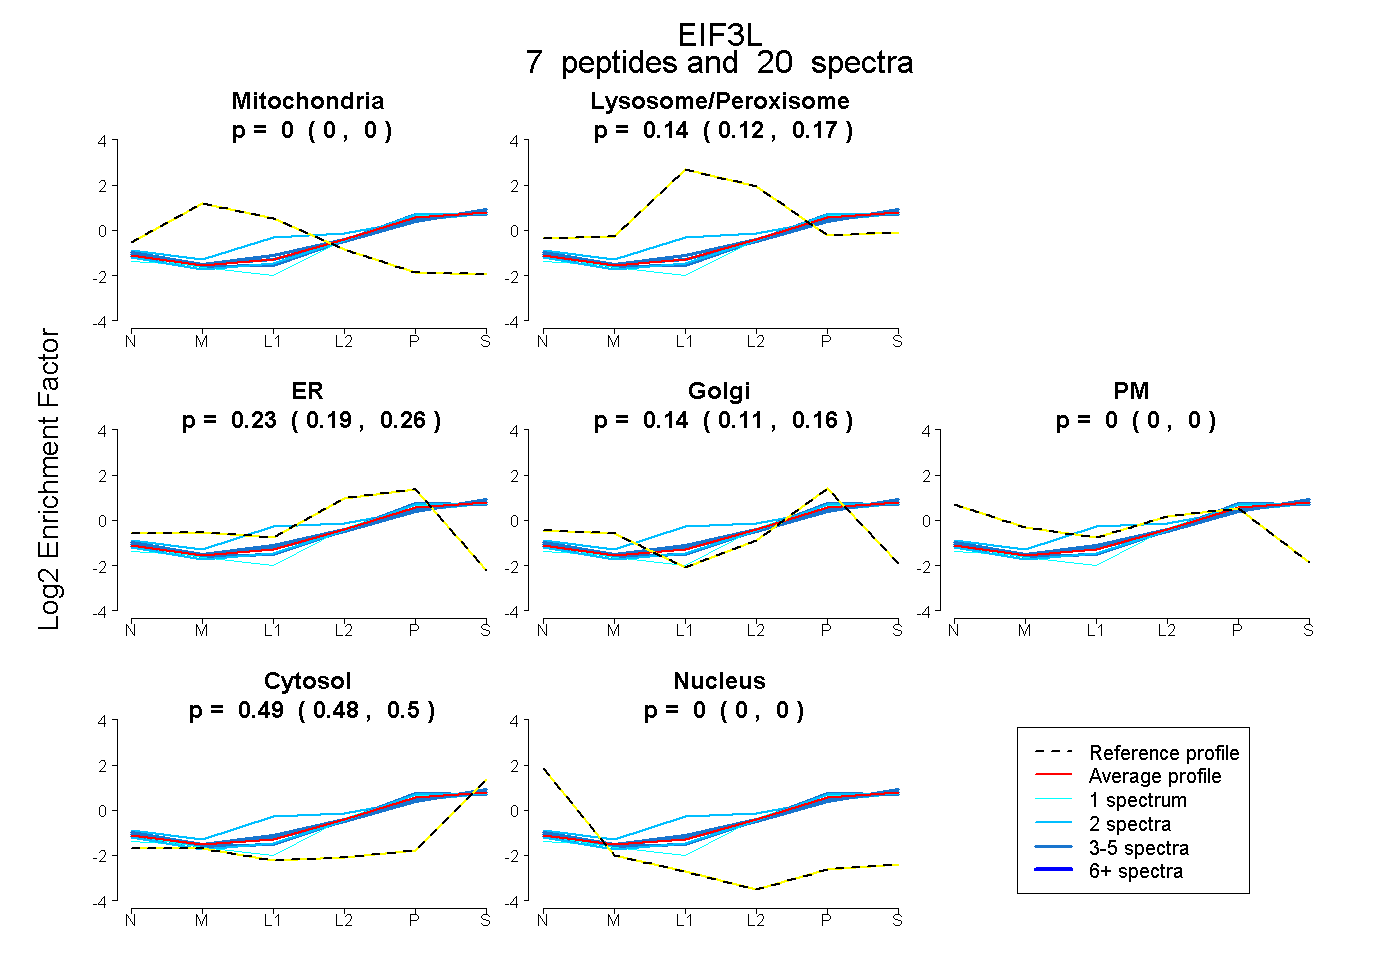
0.000 | 0.000
0.122 | 0.165
0.185 | 0.260
0.107 | 0.161
0.000 | 0.000
0.481 | 0.504
0.000 | 0.000
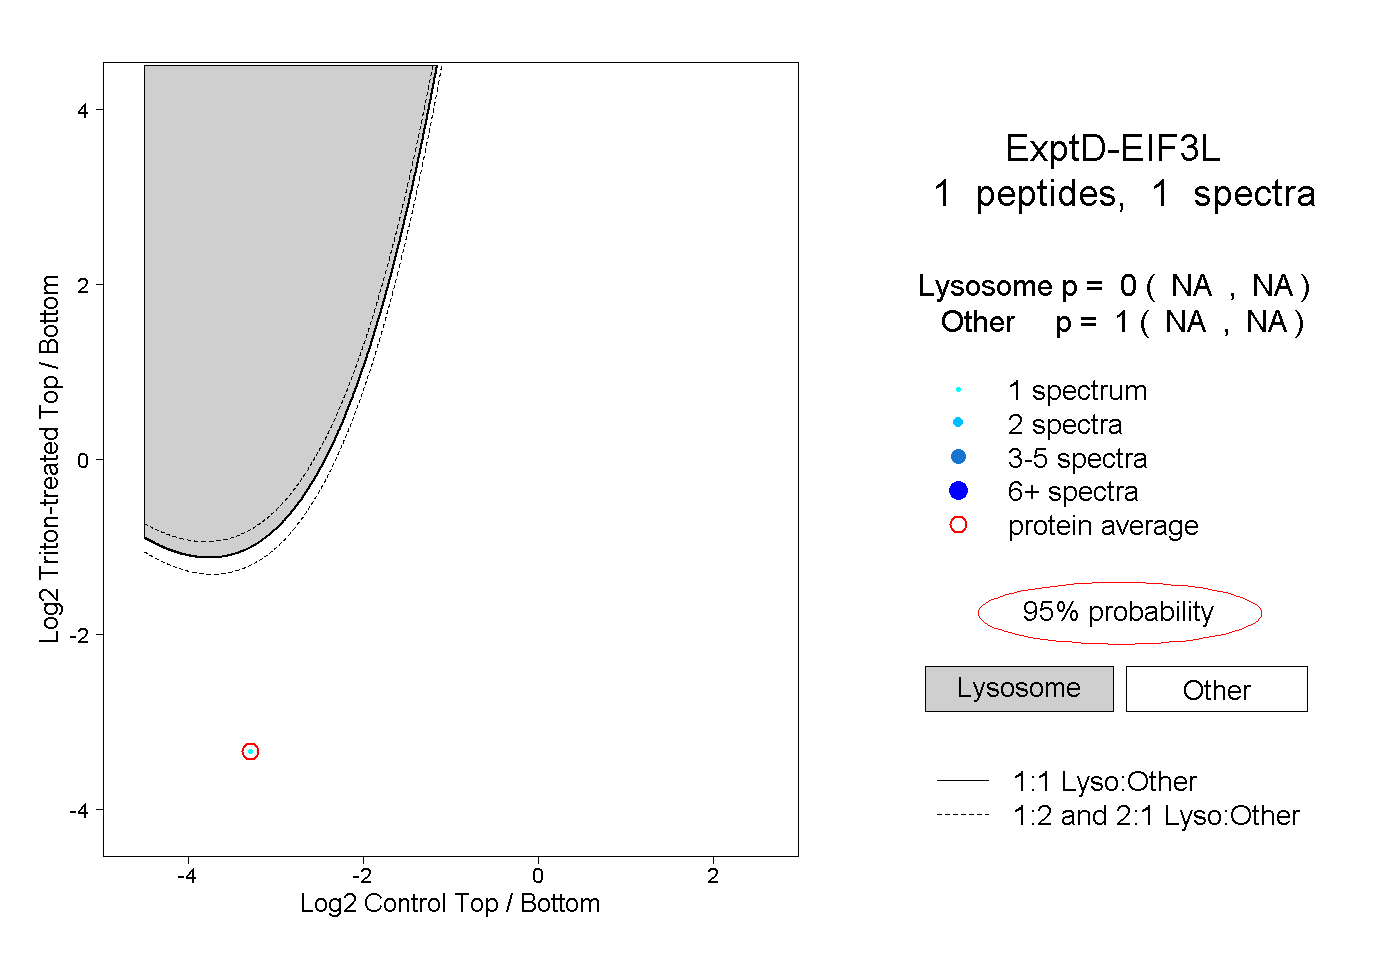
9peptides
spectra
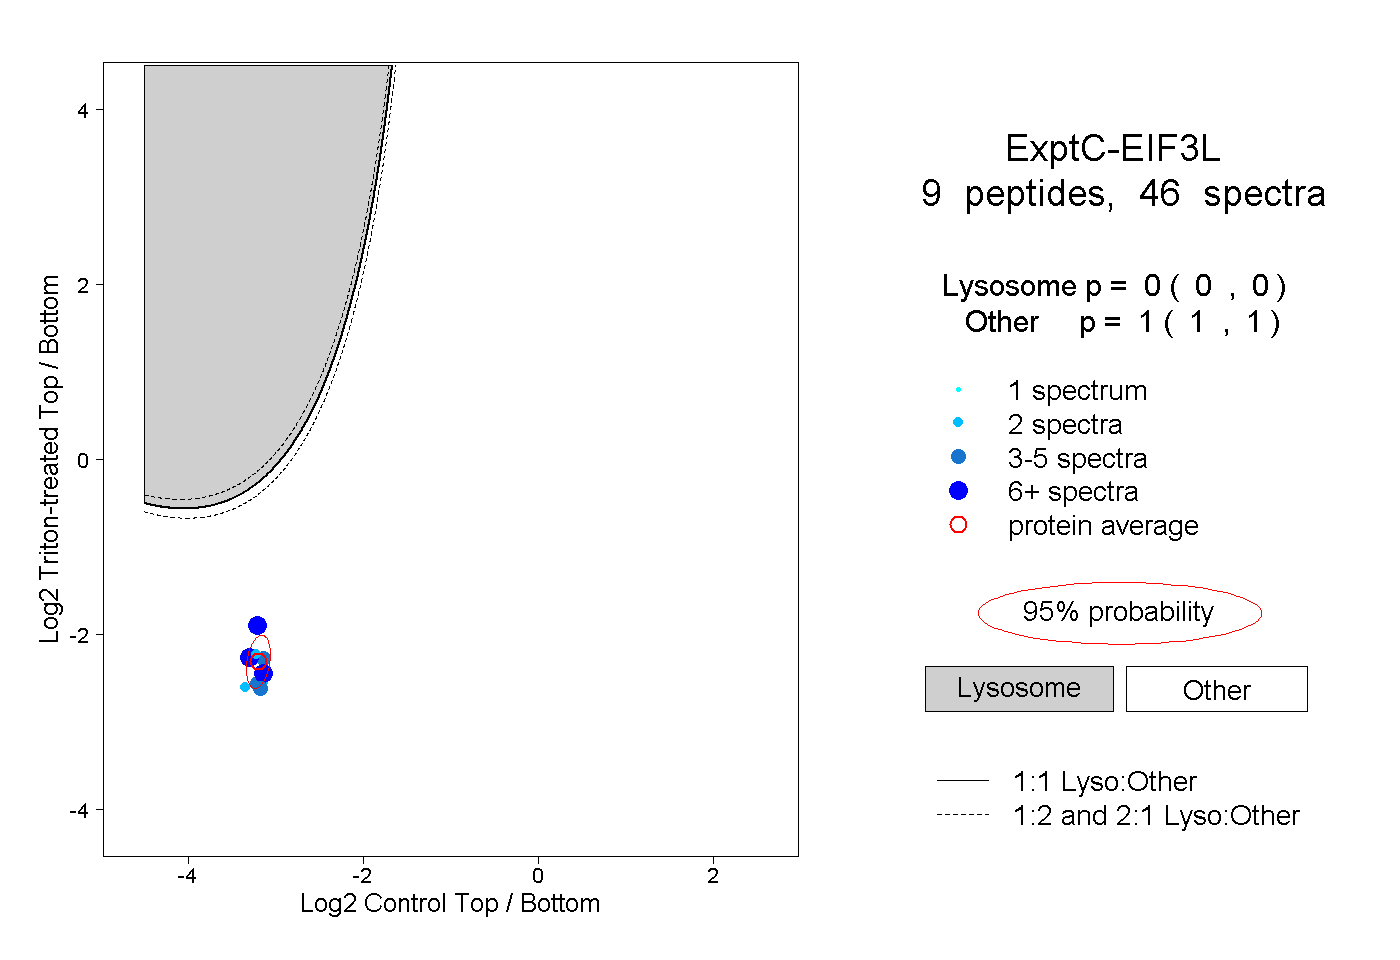
0.000 | 0.000
1.000 | 1.000