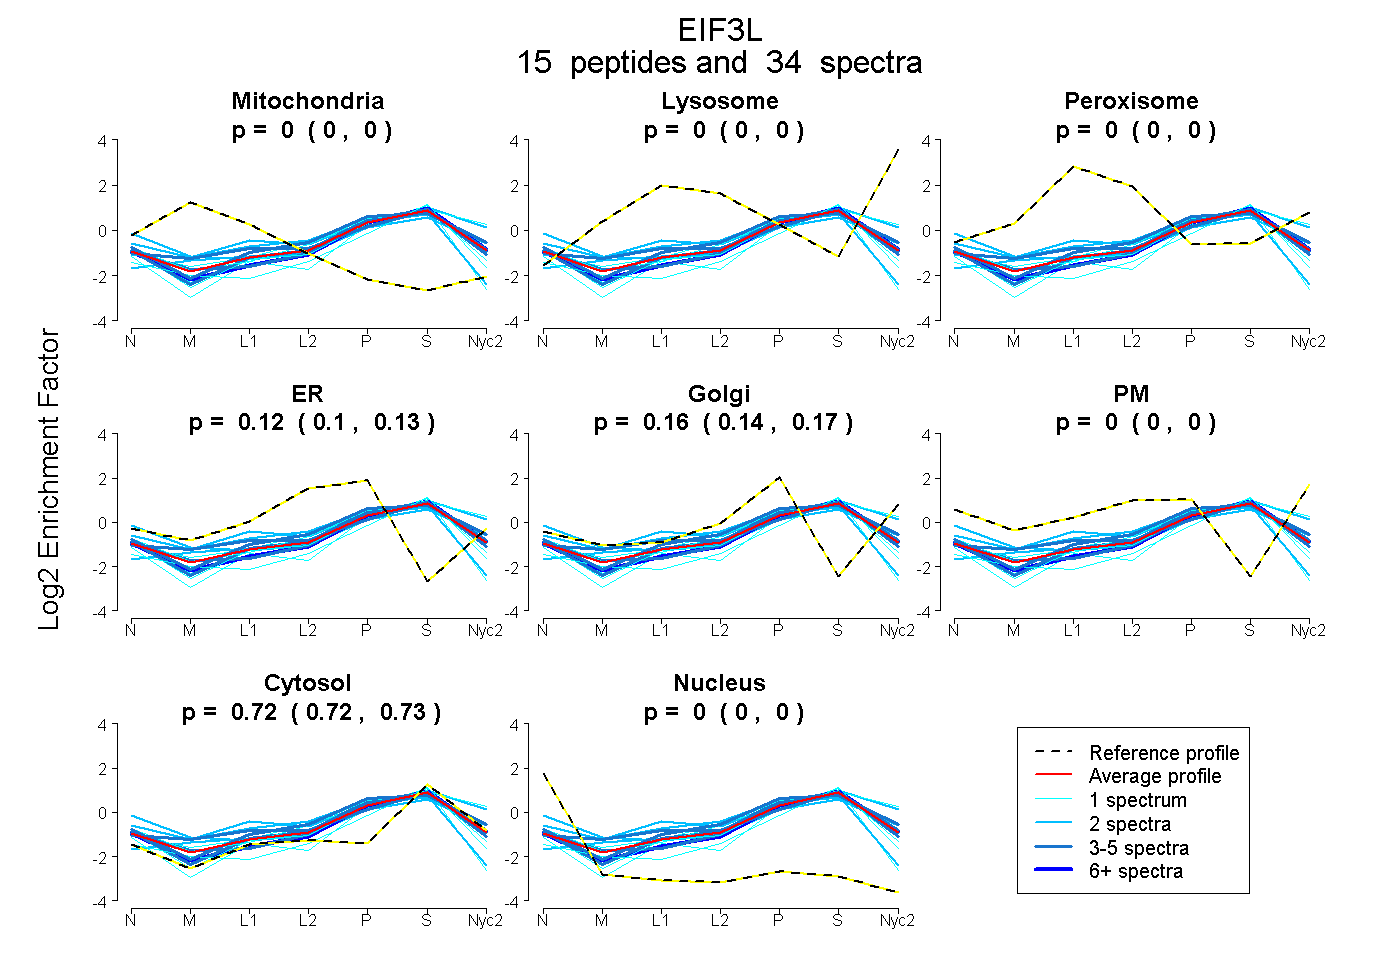
 15
15peptides
spectra
0.000 | 0.000
0.000 | 0.000
0.000 | 0.000
0.103 | 0.134
0.138 | 0.173
0.000 | 0.000
0.719 | 0.727
0.000 | 0.000
| Plot | Mito | Lyso | Perox | ER | Golgi | PM | Cytosol | Nucleus | |||||
| Expt A |
15 peptides |
34 spectra |
|
0.000 0.000 | 0.000 |
0.000 0.000 | 0.000 |
0.000 0.000 | 0.000 |
0.120 0.103 | 0.134 |
0.157 0.138 | 0.173 |
0.000 0.000 | 0.000 |
0.723 0.719 | 0.727 |
0.000 0.000 | 0.000 |
| 1 spectrum, FLSPVVPNYDNVHPNYHK | 0.000 | 0.122 | 0.000 | 0.000 | 0.228 | 0.000 | 0.650 | 0.000 | ||
| 1 spectrum, VLENIELNK | 0.000 | 0.000 | 0.000 | 0.000 | 0.103 | 0.000 | 0.857 | 0.040 | ||
| 1 spectrum, VFSDEVQQQAQLSTIR | 0.000 | 0.000 | 0.000 | 0.091 | 0.249 | 0.000 | 0.660 | 0.000 | ||
| 1 spectrum, QLEVYTSGGDPESVAGEYGR | 0.000 | 0.000 | 0.000 | 0.137 | 0.067 | 0.000 | 0.788 | 0.007 | ||
| 1 spectrum, IDESIHLQLR | 0.000 | 0.000 | 0.000 | 0.109 | 0.144 | 0.000 | 0.748 | 0.000 | ||
| 3 spectra, YEMINK | 0.002 | 0.000 | 0.086 | 0.105 | 0.127 | 0.000 | 0.679 | 0.000 | ||
| 6 spectra, IQLLVFK | 0.000 | 0.000 | 0.000 | 0.000 | 0.247 | 0.000 | 0.753 | 0.000 | ||
| 1 spectrum, GDPQVYEELFSYACPK | 0.000 | 0.000 | 0.000 | 0.068 | 0.000 | 0.000 | 0.815 | 0.117 | ||
| 2 spectra, EPFLQQLK | 0.000 | 0.000 | 0.162 | 0.032 | 0.241 | 0.000 | 0.565 | 0.000 | ||
| 2 spectra, DMIHIADTK | 0.000 | 0.120 | 0.000 | 0.000 | 0.198 | 0.000 | 0.682 | 0.000 | ||
| 4 spectra, SEEEIDFLR | 0.000 | 0.000 | 0.000 | 0.103 | 0.165 | 0.000 | 0.733 | 0.000 | ||
| 3 spectra, YGDFFIR | 0.000 | 0.000 | 0.000 | 0.161 | 0.183 | 0.000 | 0.656 | 0.000 | ||
| 2 spectra, LYTTMPVAK | 0.065 | 0.000 | 0.000 | 0.296 | 0.000 | 0.000 | 0.640 | 0.000 | ||
| 2 spectra, FEELNR | 0.055 | 0.000 | 0.000 | 0.000 | 0.250 | 0.072 | 0.617 | 0.006 | ||
| 4 spectra, LAGFLDLTEQEFR | 0.000 | 0.000 | 0.000 | 0.043 | 0.225 | 0.000 | 0.733 | 0.000 |
| Plot | Mito | Lyso or Perox | ER | Golgi | PM | Cytosol | Nucleus | ||||||
| Expt B |
7 peptides |
20 spectra |
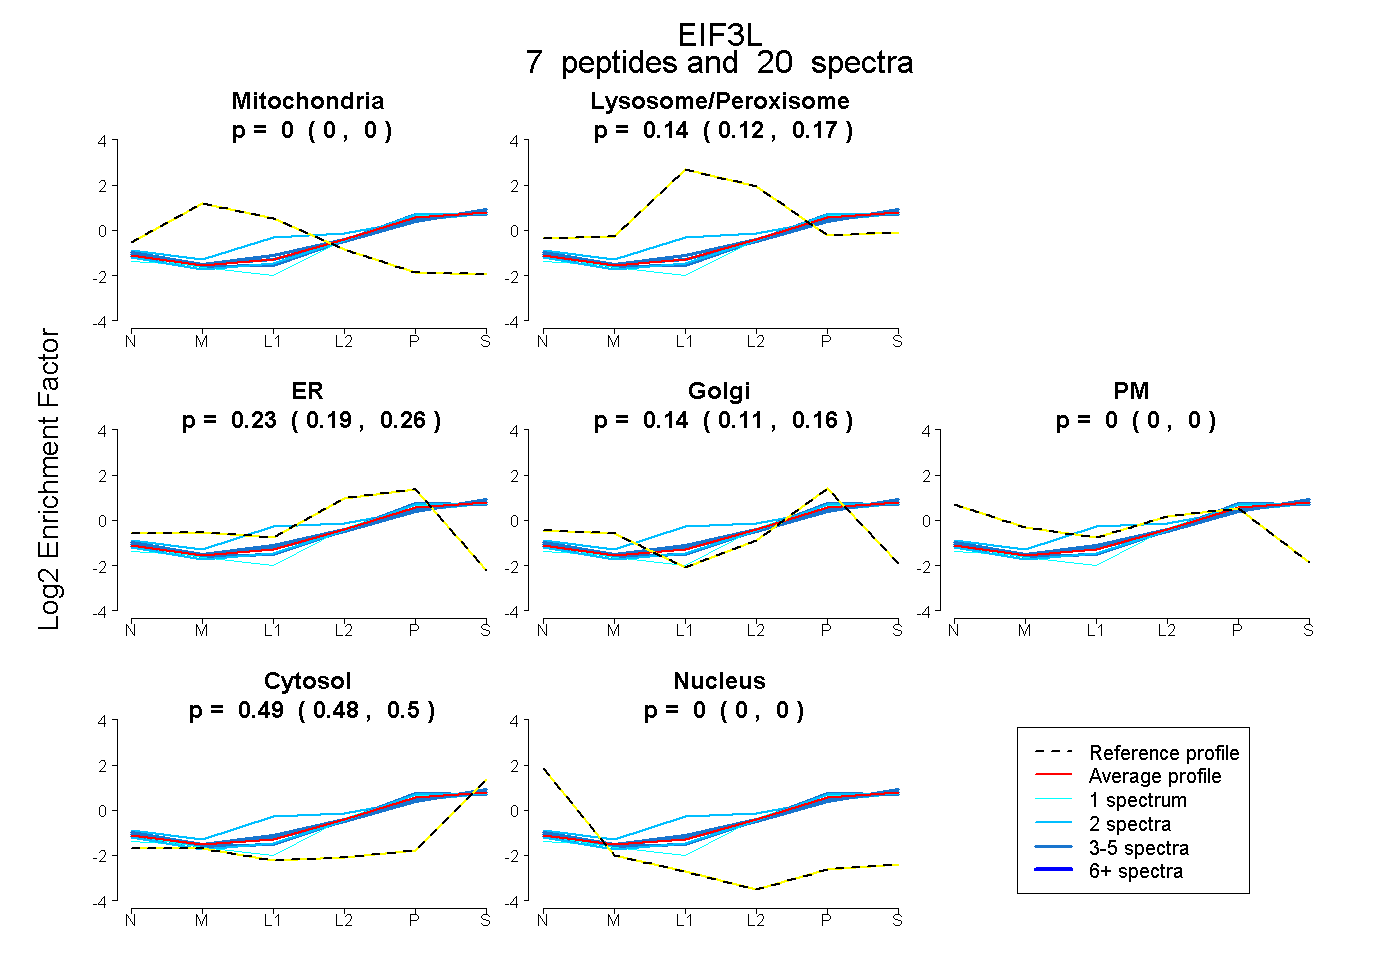 |
0.000 0.000 | 0.000 |
0.144 0.122 | 0.165 |
0.226 0.185 | 0.260 |
0.136 0.107 | 0.161 |
0.000 0.000 | 0.000 |
0.494 0.481 | 0.504 |
0.000 0.000 | 0.000 |
|||
| Plot | Lyso | Other | |||||||||||
| Expt C |
9 peptides |
46 spectra |
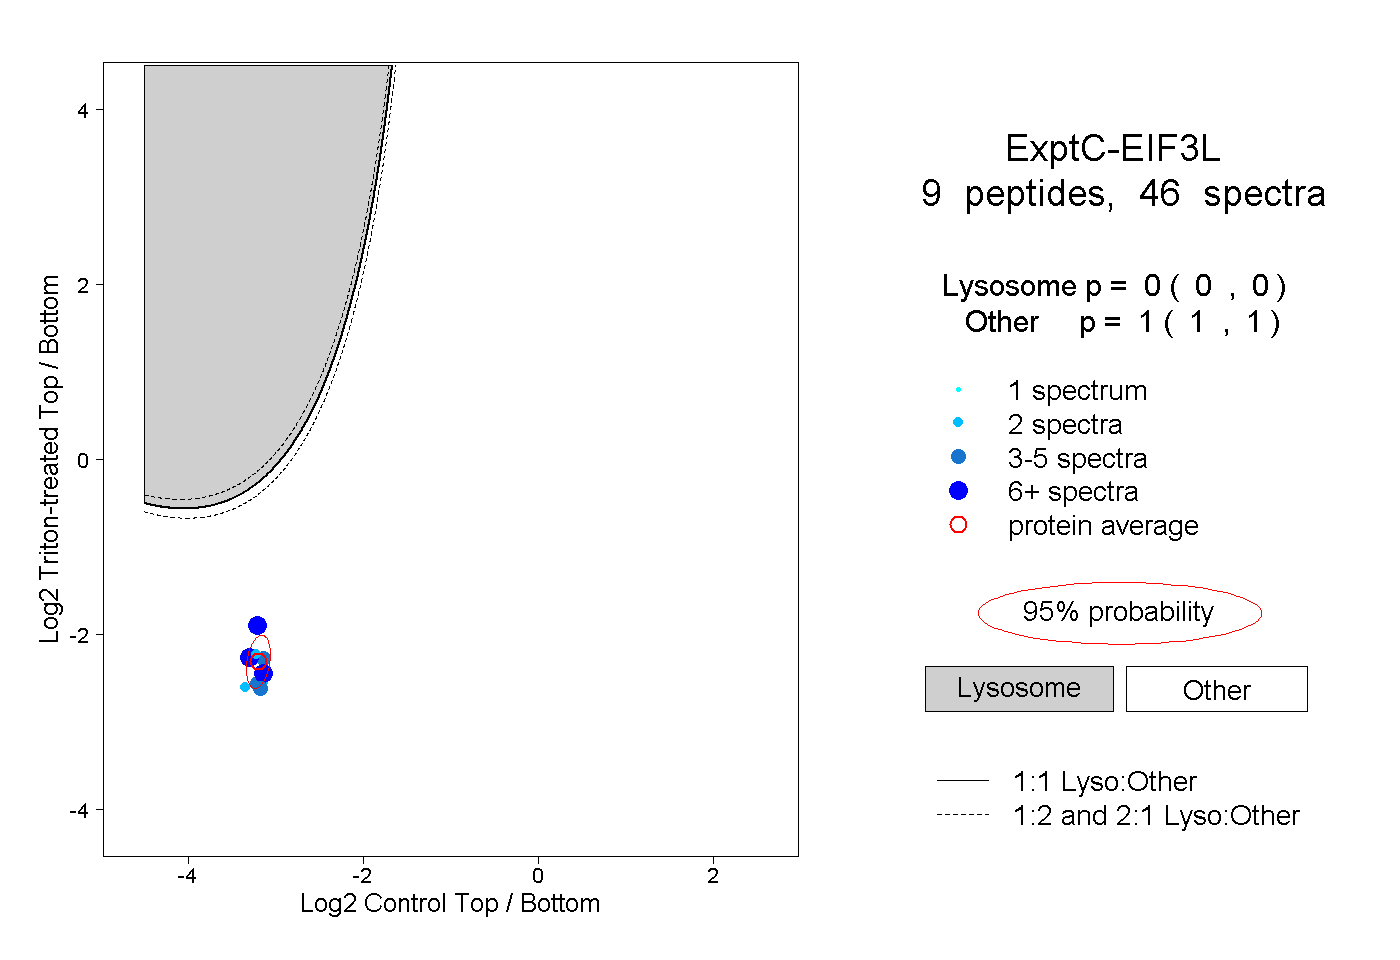 |
0.000 0.000 | 0.000 |
1.000 1.000 | 1.000 |
||||||||
| Plot | Lyso | Other | |||||||||||
| Expt D |
1 peptide |
1 spectrum |
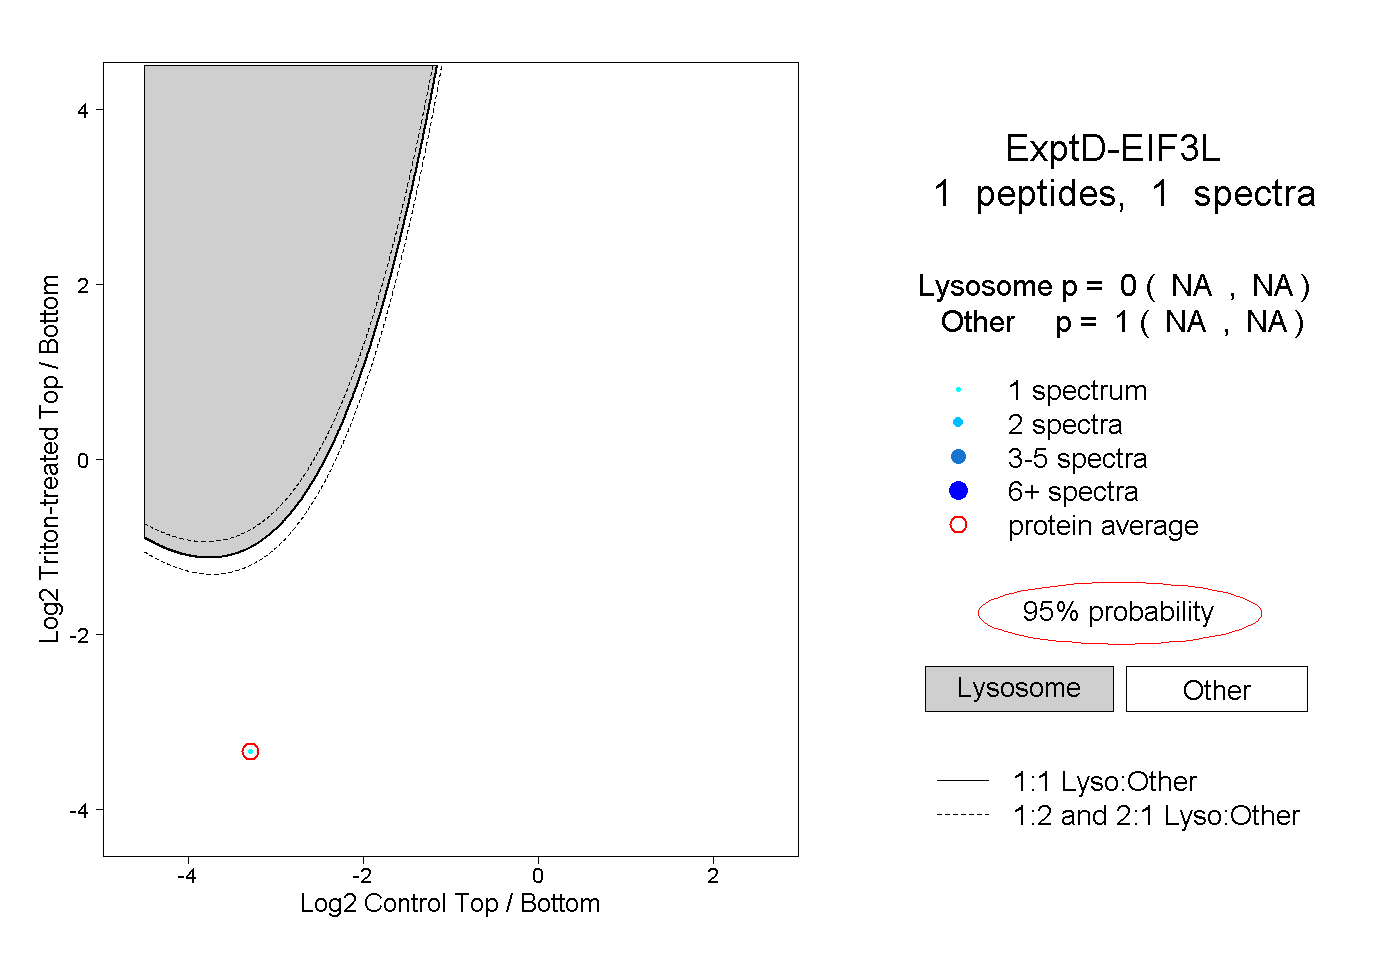 |
0.000 NA | NA |
1.000 NA | NA |