 2
2peptides
spectra
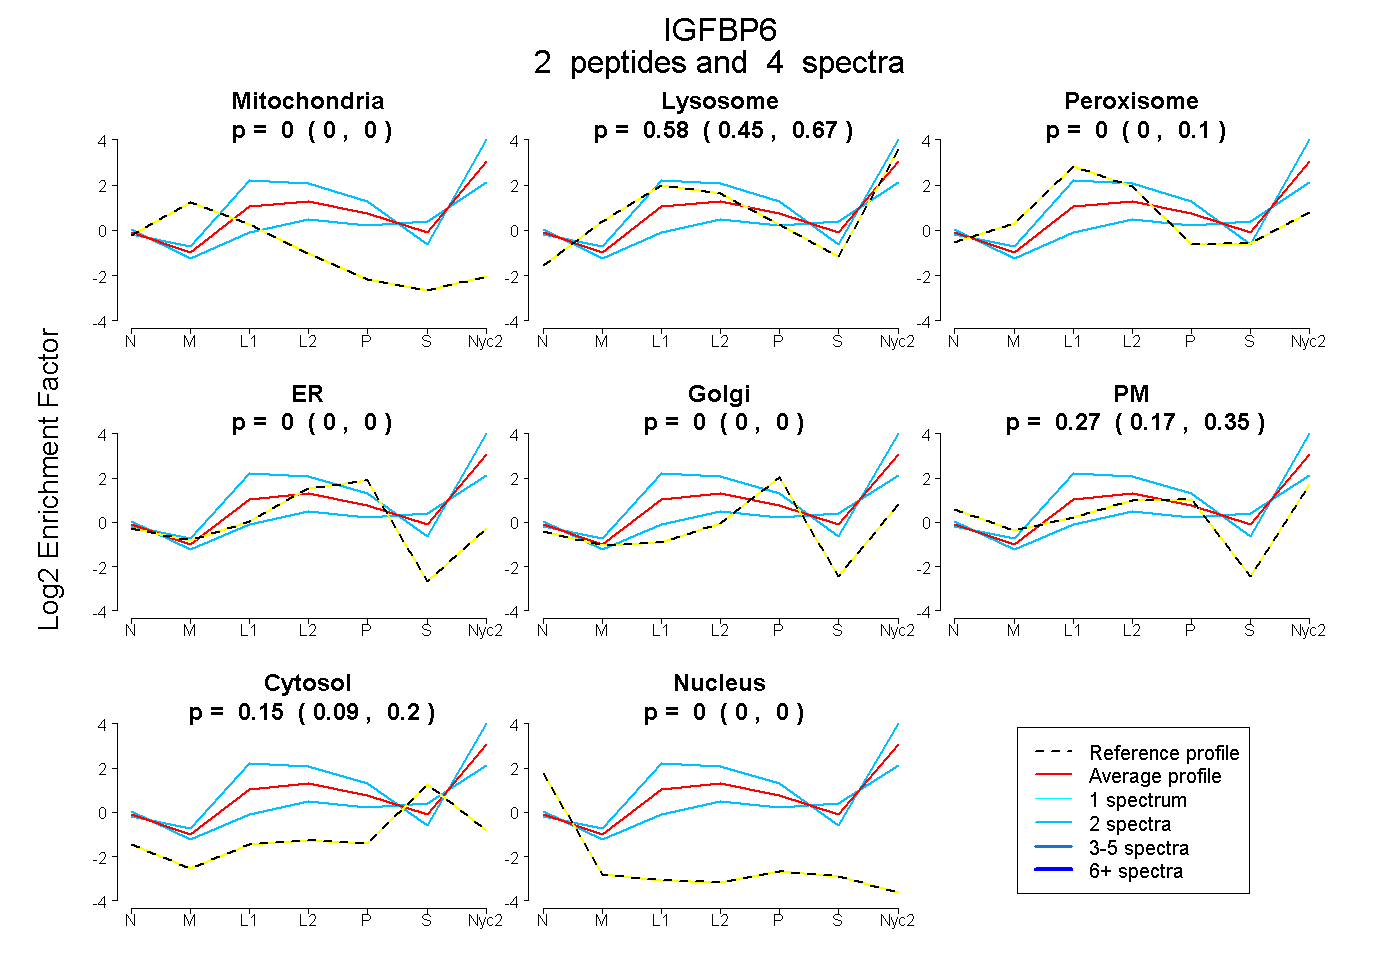
0.000 | 0.000
0.454 | 0.669
0.000 | 0.101
0.000 | 0.000
0.000 | 0.000
0.166 | 0.353
0.087 | 0.199
0.000 | 0.000
2peptides
spectra
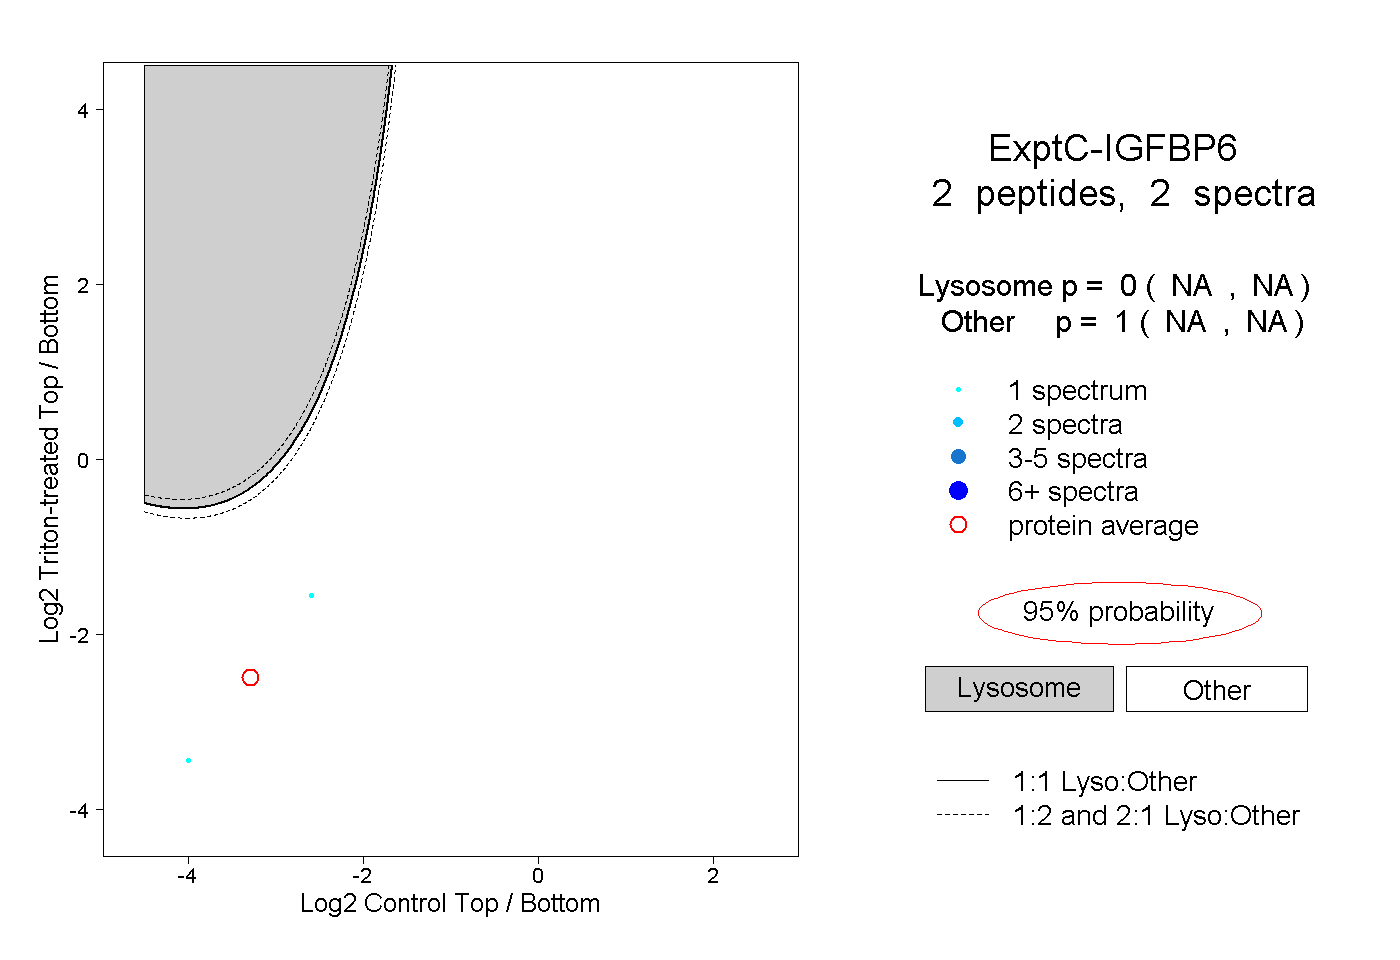
NA | NA
NA | NA
1peptide
spectrum
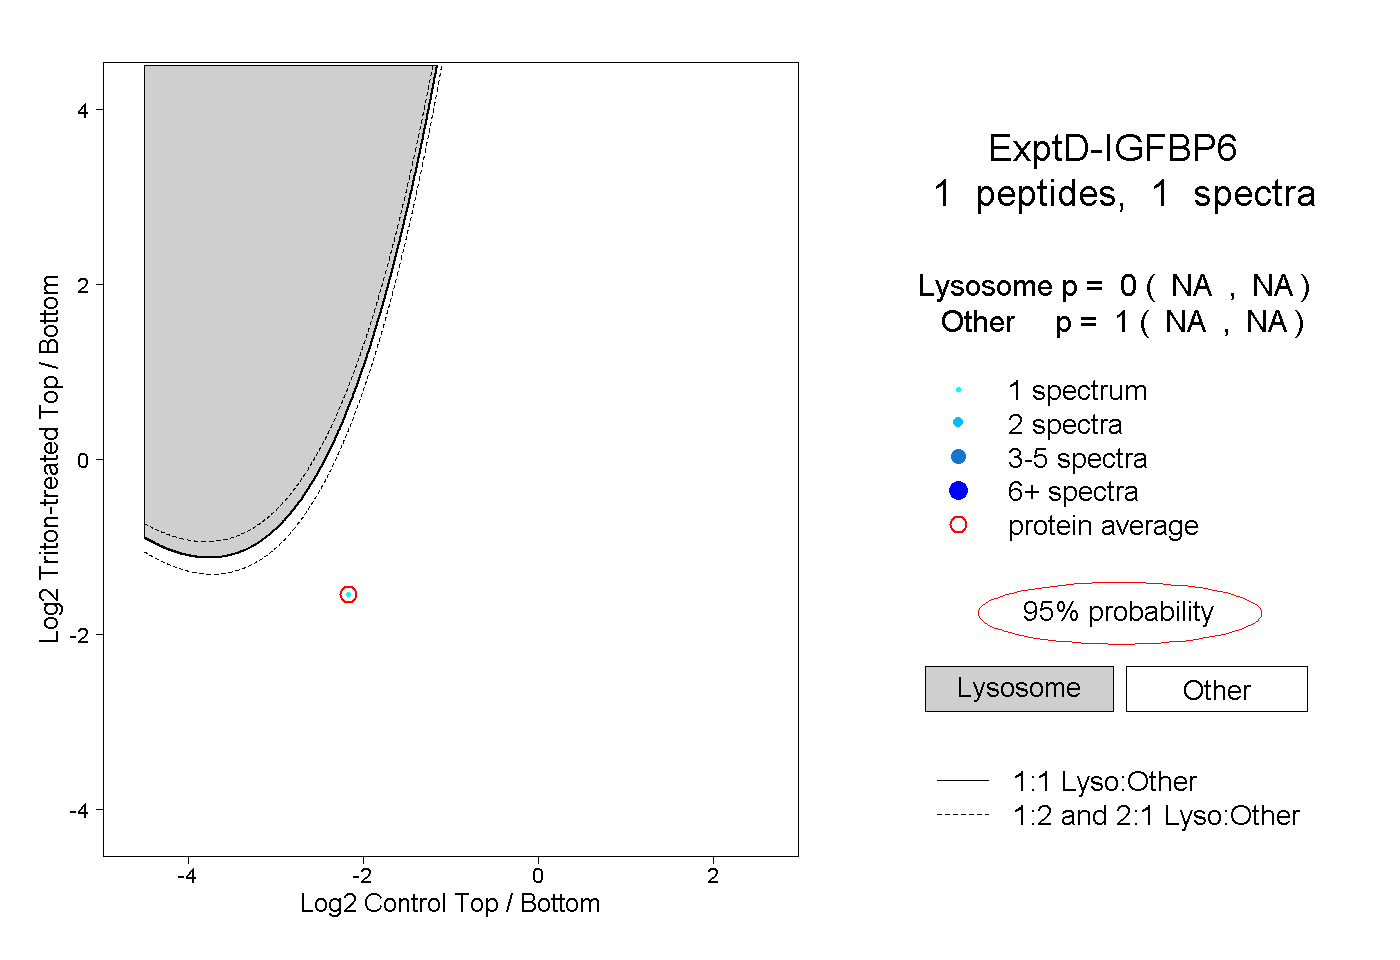
NA | NA
NA | NA