 9
9peptides
spectra
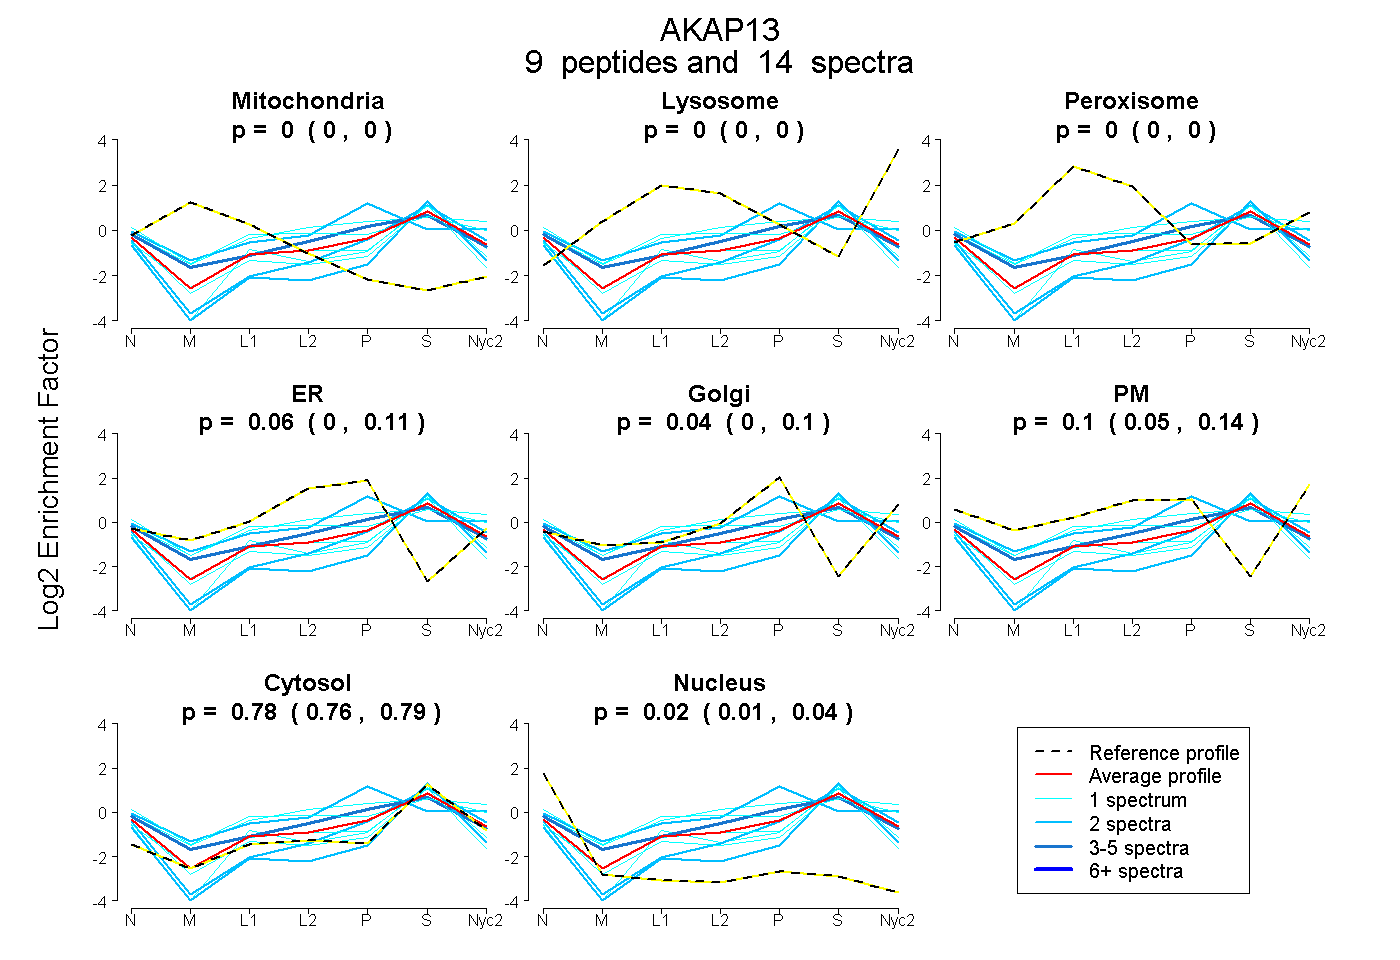
0.000 | 0.000
0.000 | 0.000
0.000 | 0.000
0.002 | 0.106
0.000 | 0.100
0.047 | 0.144
0.756 | 0.790
0.009 | 0.037
| Plot | Mito | Lyso | Perox | ER | Golgi | PM | Cytosol | Nucleus | |||||
| Expt A |
9 peptides |
14 spectra |
|
0.000 0.000 | 0.000 |
0.000 0.000 | 0.000 |
0.000 0.000 | 0.000 |
0.060 0.002 | 0.106 |
0.037 0.000 | 0.100 |
0.103 0.047 | 0.144 |
0.775 0.756 | 0.790 |
0.025 0.009 | 0.037 |
| 2 spectra, STVCCQGSPGR | 0.000 | 0.000 | 0.000 | 0.000 | 0.000 | 0.000 | 0.837 | 0.163 | ||
| 3 spectra, ETLMHFAVR | 0.000 | 0.000 | 0.000 | 0.220 | 0.022 | 0.085 | 0.671 | 0.002 | ||
| 1 spectrum, RPPIHR | 0.000 | 0.000 | 0.167 | 0.000 | 0.000 | 0.272 | 0.560 | 0.000 | ||
| 1 spectrum, ENLASCAK | 0.000 | 0.000 | 0.126 | 0.000 | 0.044 | 0.322 | 0.509 | 0.000 | ||
| 1 spectrum, VLLCASK | 0.000 | 0.000 | 0.012 | 0.000 | 0.000 | 0.000 | 0.835 | 0.153 | ||
| 1 spectrum, EGATPVSLALER | 0.000 | 0.000 | 0.015 | 0.038 | 0.000 | 0.069 | 0.854 | 0.024 | ||
| 1 spectrum, DISDLLNQEK | 0.000 | 0.000 | 0.000 | 0.005 | 0.000 | 0.000 | 0.935 | 0.060 | ||
| 2 spectra, DTGRPGEGVEPASAVDSR | 0.000 | 0.000 | 0.000 | 0.000 | 0.093 | 0.000 | 0.847 | 0.060 | ||
| 2 spectra, QQAQHLEEK | 0.000 | 0.000 | 0.125 | 0.019 | 0.488 | 0.003 | 0.366 | 0.000 |
| Plot | Lyso | Other | |||||||||||
| Expt C |
8 peptides |
17 spectra |
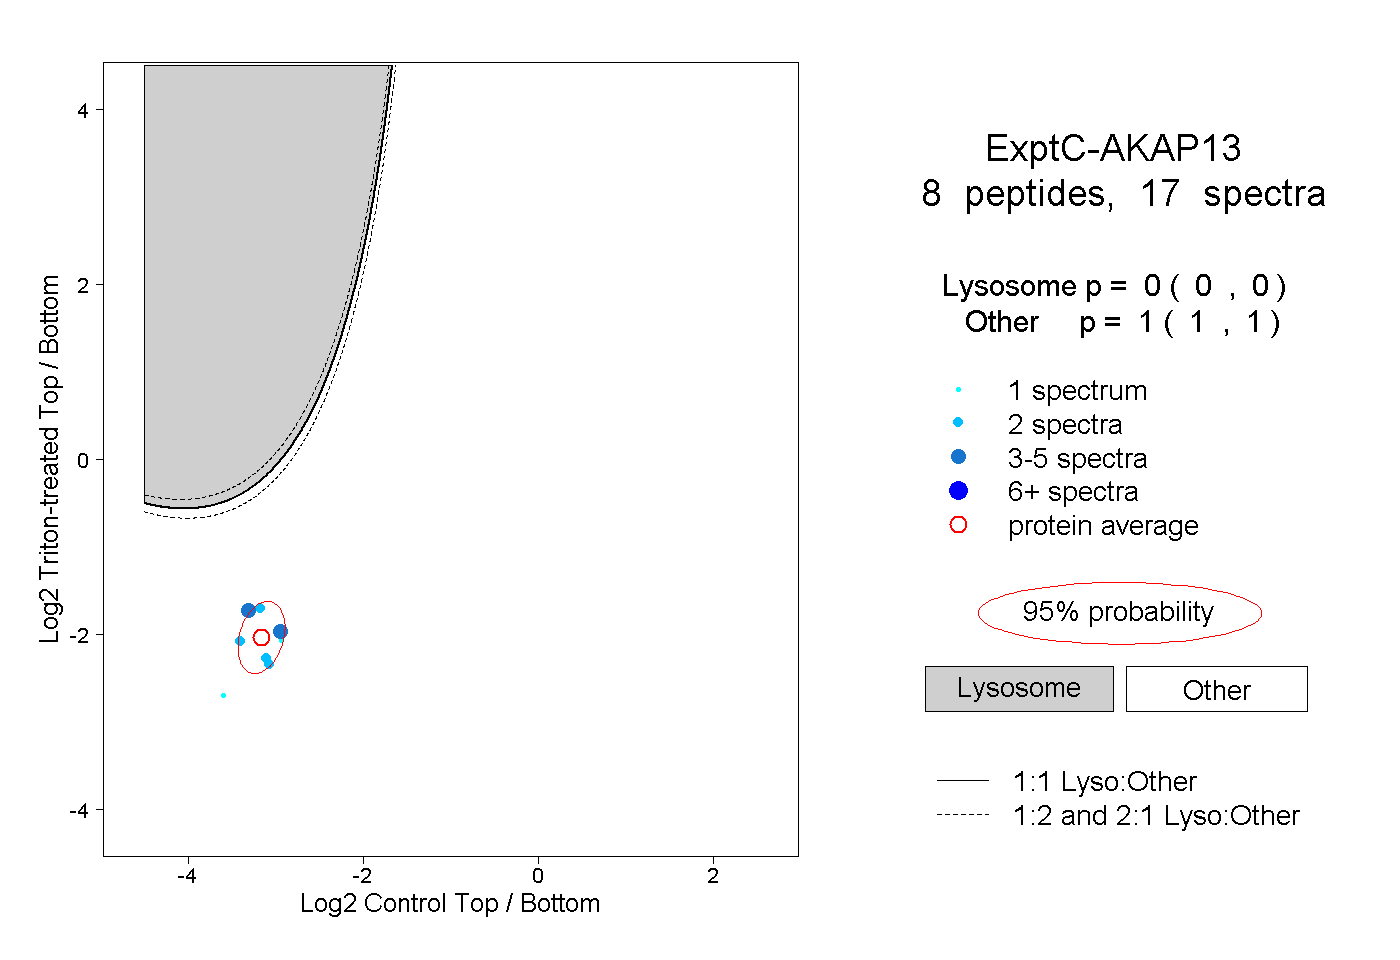 |
0.000 0.000 | 0.000 |
1.000 1.000 | 1.000 |
||||||||
| Plot | Lyso | Other | |||||||||||
| Expt D |
1 peptide |
1 spectrum |
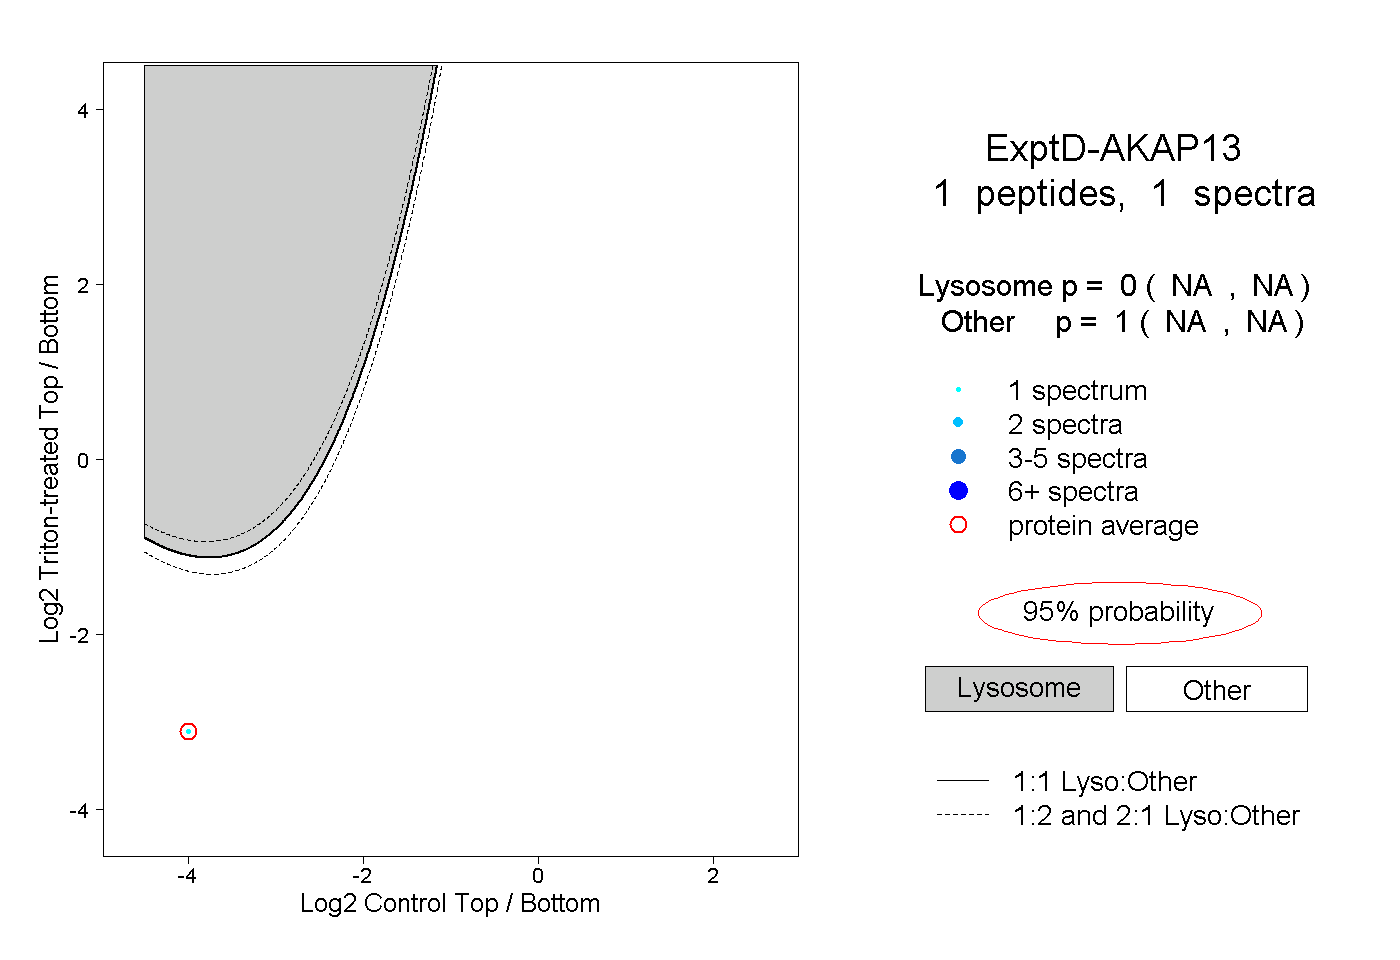 |
0.000 NA | NA |
1.000 NA | NA |