25
25peptides
spectra
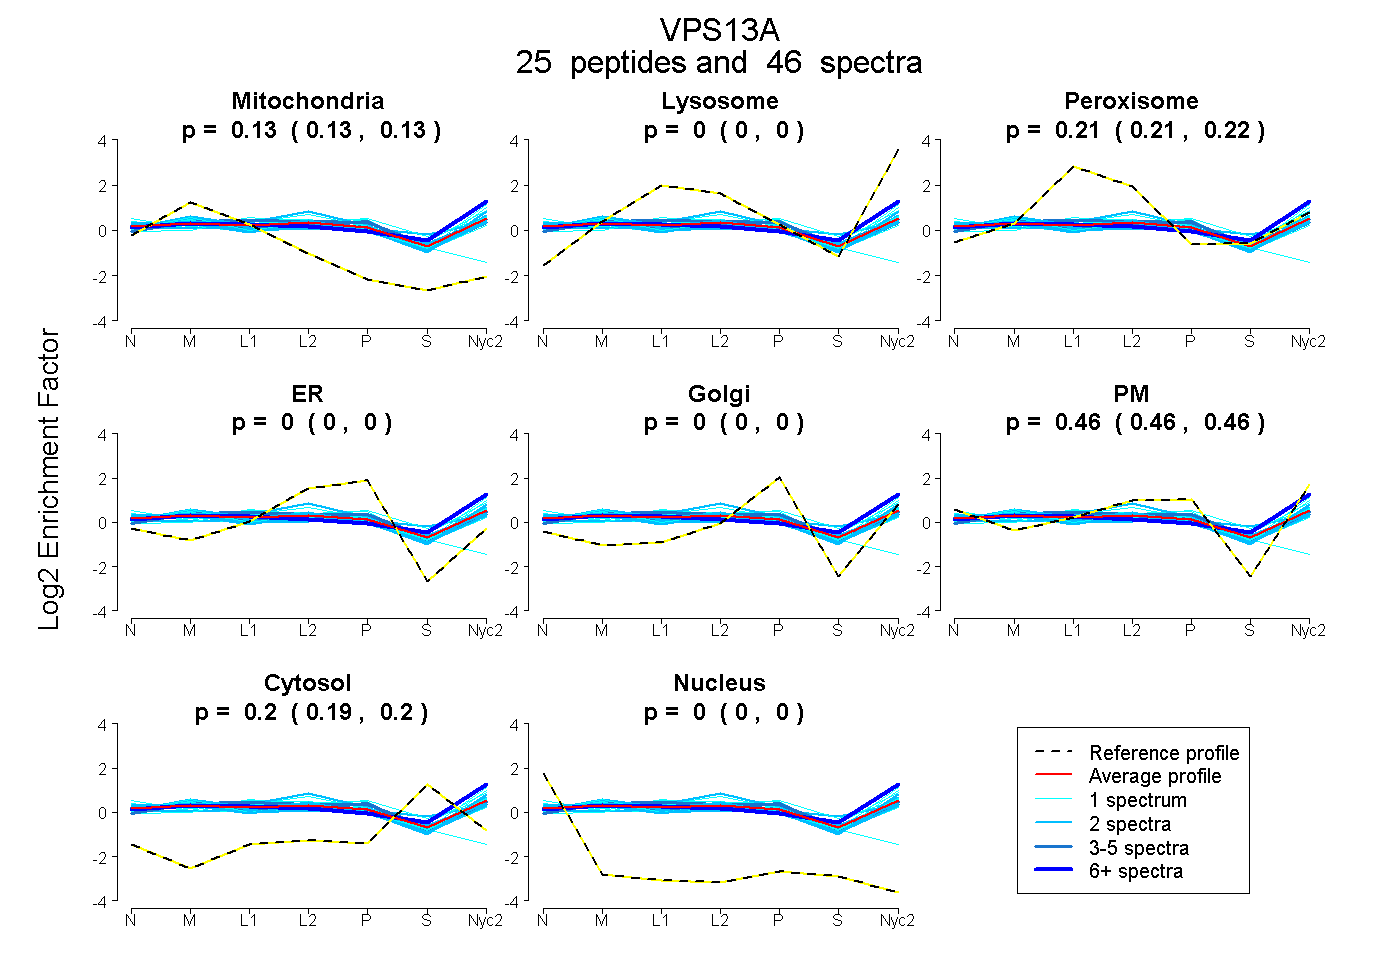
0.127 | 0.133
0.000 | 0.000
0.212 | 0.217
0.000 | 0.000
0.000 | 0.000
0.455 | 0.462
0.194 | 0.197
0.000 | 0.000
8peptides
spectra
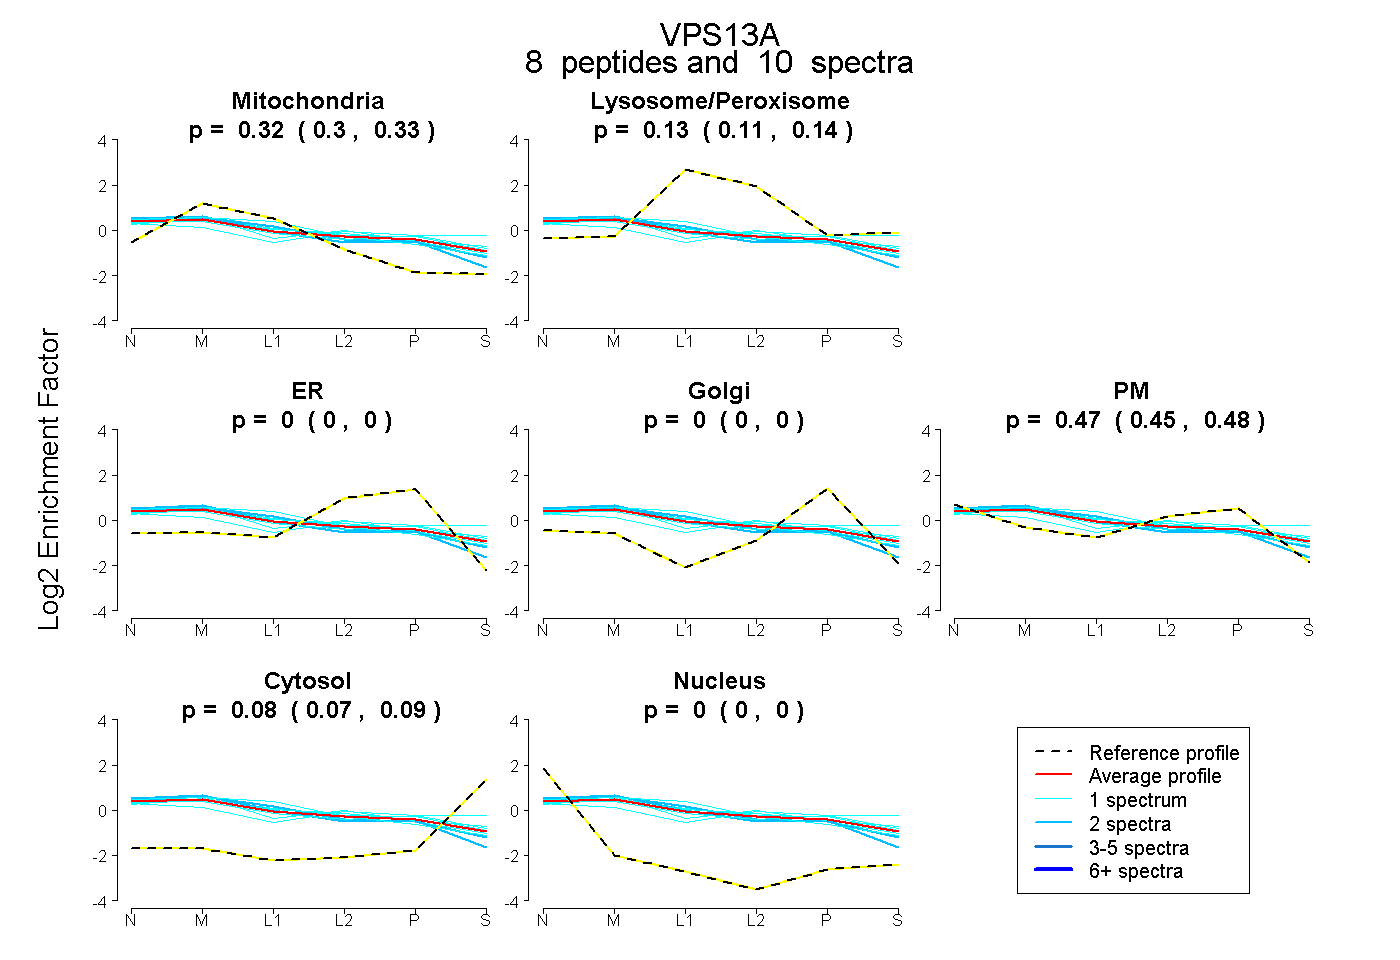
0.301 | 0.332
0.111 | 0.141
0.000 | 0.000
0.000 | 0.000
0.454 | 0.485
0.069 | 0.095
0.000 | 0.000