 21
21peptides
spectra
0.000 | 0.004
0.000 | 0.000
0.000 | 0.000
0.085 | 0.108
0.048 | 0.069
0.709 | 0.725
0.000 | 0.000
0.122 | 0.126
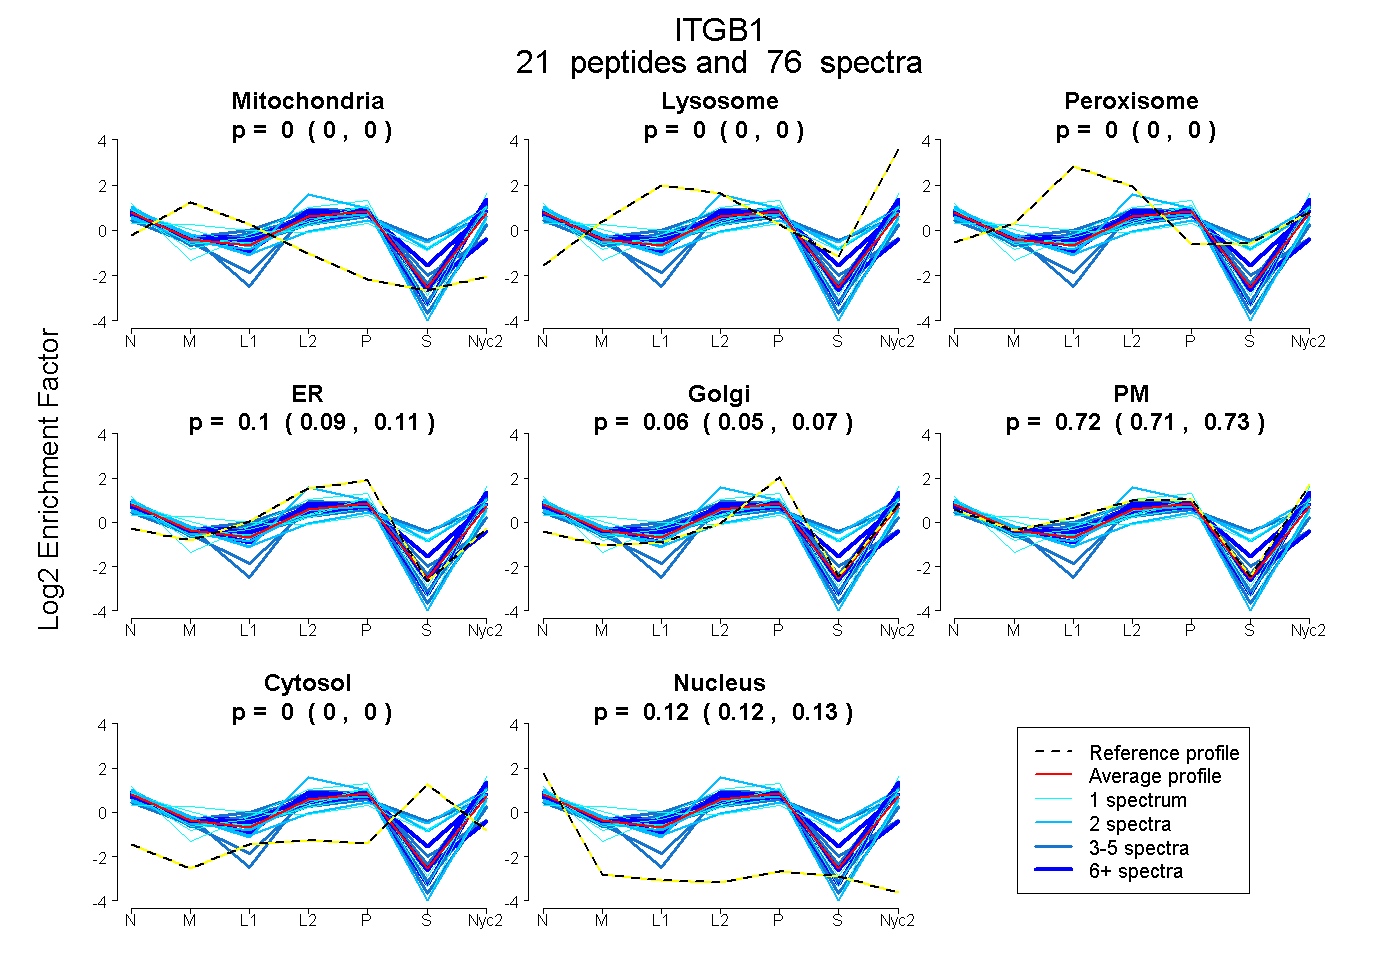
| Plot | Mito | Lyso | Perox | ER | Golgi | PM | Cytosol | Nucleus | |||||
| Expt A |
21 peptides |
76 spectra |
|
0.002 0.000 | 0.004 |
0.000 0.000 | 0.000 |
0.000 0.000 | 0.000 |
0.098 0.085 | 0.108 |
0.059 0.048 | 0.069 |
0.718 0.709 | 0.725 |
0.000 0.000 | 0.000 |
0.124 0.122 | 0.126 |
| 3 spectra, CNCQSHGIPASPK | 0.000 | 0.000 | 0.000 | 0.331 | 0.180 | 0.267 | 0.015 | 0.207 | ||
| 2 spectra, LLMIIHDR | 0.000 | 0.000 | 0.000 | 0.000 | 0.000 | 0.652 | 0.348 | 0.000 | ||
| 1 spectrum, LRPEDITQIQPQQLLLK | 0.000 | 0.000 | 0.000 | 0.116 | 0.042 | 0.810 | 0.000 | 0.032 | ||
| 2 spectra, SNGLICGGNGVCR | 0.000 | 0.000 | 0.000 | 0.353 | 0.000 | 0.559 | 0.000 | 0.088 | ||
| 1 spectrum, SAVTTVVNPK | 0.000 | 0.000 | 0.000 | 0.000 | 0.027 | 0.886 | 0.000 | 0.087 | ||
| 8 spectra, GICECGACK | 0.066 | 0.000 | 0.000 | 0.453 | 0.000 | 0.333 | 0.000 | 0.149 | ||
| 2 spectra, IGFGSFVEK | 0.008 | 0.000 | 0.000 | 0.177 | 0.000 | 0.680 | 0.000 | 0.136 | ||
| 4 spectra, DDLENVK | 0.000 | 0.000 | 0.008 | 0.000 | 0.000 | 0.643 | 0.349 | 0.000 | ||
| 2 spectra, NVLSLTDR | 0.000 | 0.000 | 0.000 | 0.001 | 0.009 | 0.708 | 0.278 | 0.003 | ||
| 7 spectra, ENTNEIYSGK | 0.000 | 0.000 | 0.000 | 0.026 | 0.000 | 0.887 | 0.000 | 0.087 | ||
| 5 spectra, ECVQCR | 0.025 | 0.000 | 0.000 | 0.331 | 0.000 | 0.516 | 0.000 | 0.128 | ||
| 1 spectrum, WDTGENPIYK | 0.140 | 0.124 | 0.000 | 0.000 | 0.000 | 0.535 | 0.201 | 0.000 | ||
| 2 spectra, GCQPSDIENPR | 0.000 | 0.000 | 0.000 | 0.190 | 0.000 | 0.659 | 0.000 | 0.151 | ||
| 3 spectra, GSQTIK | 0.000 | 0.000 | 0.000 | 0.031 | 0.040 | 0.839 | 0.000 | 0.090 | ||
| 1 spectrum, LPDGVTINYK | 0.099 | 0.000 | 0.000 | 0.141 | 0.114 | 0.551 | 0.000 | 0.094 | ||
| 5 spectra, CDDLEALK | 0.039 | 0.000 | 0.000 | 0.095 | 0.000 | 0.817 | 0.000 | 0.050 | ||
| 4 spectra, FCECDNFNCDR | 0.000 | 0.000 | 0.000 | 0.182 | 0.247 | 0.387 | 0.000 | 0.185 | ||
| 7 spectra, GEFFNELVGQQR | 0.031 | 0.000 | 0.000 | 0.003 | 0.029 | 0.753 | 0.147 | 0.036 | ||
| 1 spectrum, TVMPYISTTPAK | 0.000 | 0.000 | 0.000 | 0.005 | 0.132 | 0.763 | 0.000 | 0.100 | ||
| 14 spectra, SLGTDLMNEMR | 0.000 | 0.000 | 0.000 | 0.000 | 0.042 | 0.883 | 0.000 | 0.075 | ||
| 1 spectrum, ESETLK | 0.000 | 0.000 | 0.000 | 0.000 | 0.000 | 0.700 | 0.293 | 0.006 |
| Plot | Mito | Lyso or Perox | ER | Golgi | PM | Cytosol | Nucleus | ||||||
| Expt B |
5 peptides |
7 spectra |
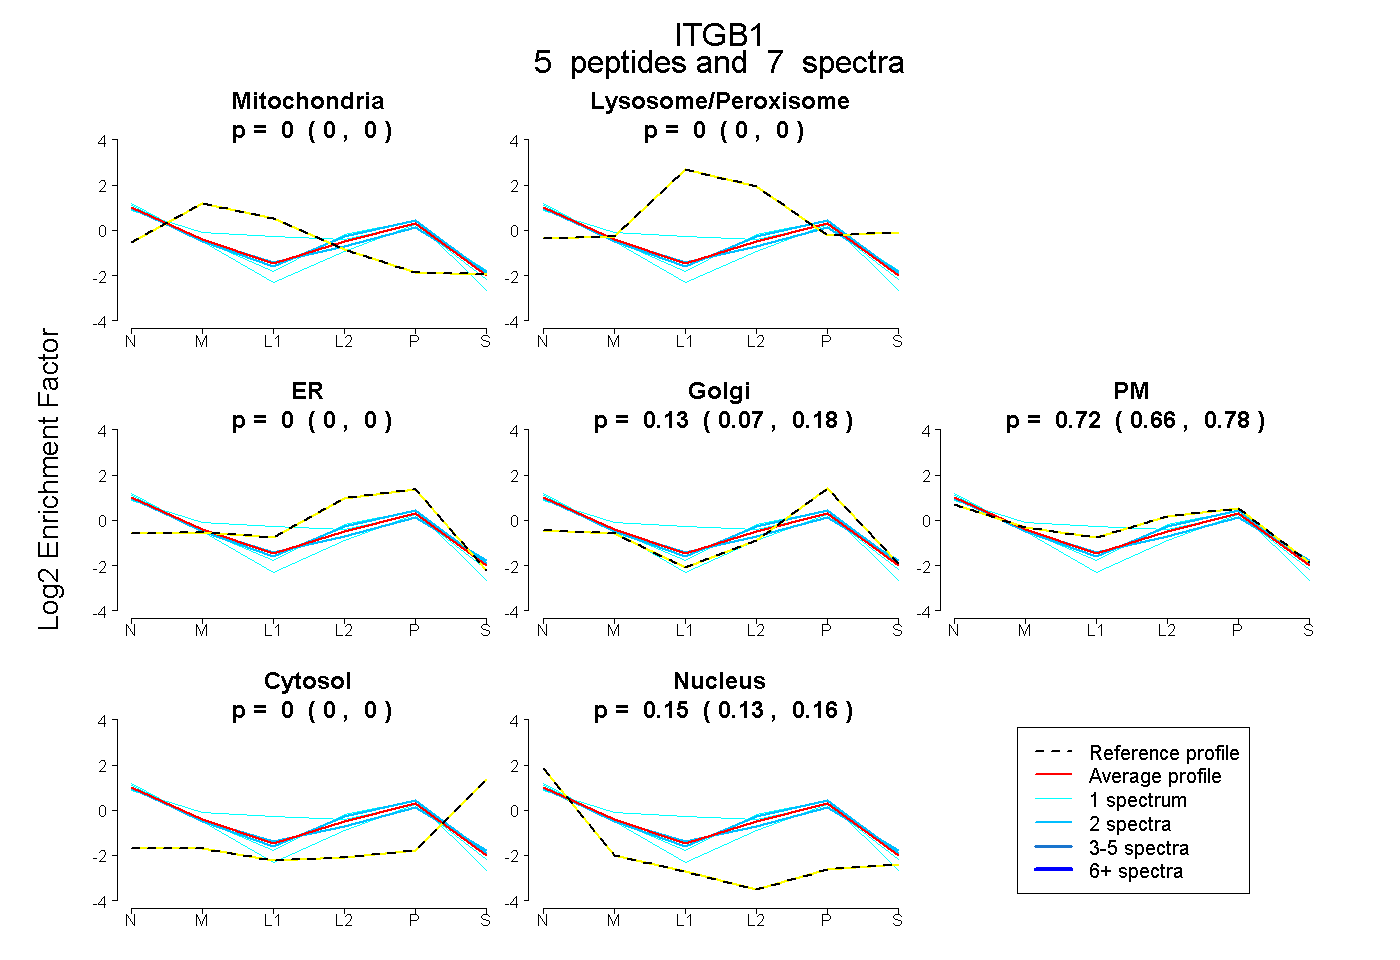 |
0.000 0.000 | 0.000 |
0.000 0.000 | 0.000 |
0.000 0.000 | 0.000 |
0.127 0.068 | 0.177 |
0.723 0.656 | 0.779 |
0.000 0.000 | 0.000 |
0.150 0.132 | 0.164 |
|||
| Plot | Lyso | Other | |||||||||||
| Expt C |
16 peptides |
96 spectra |
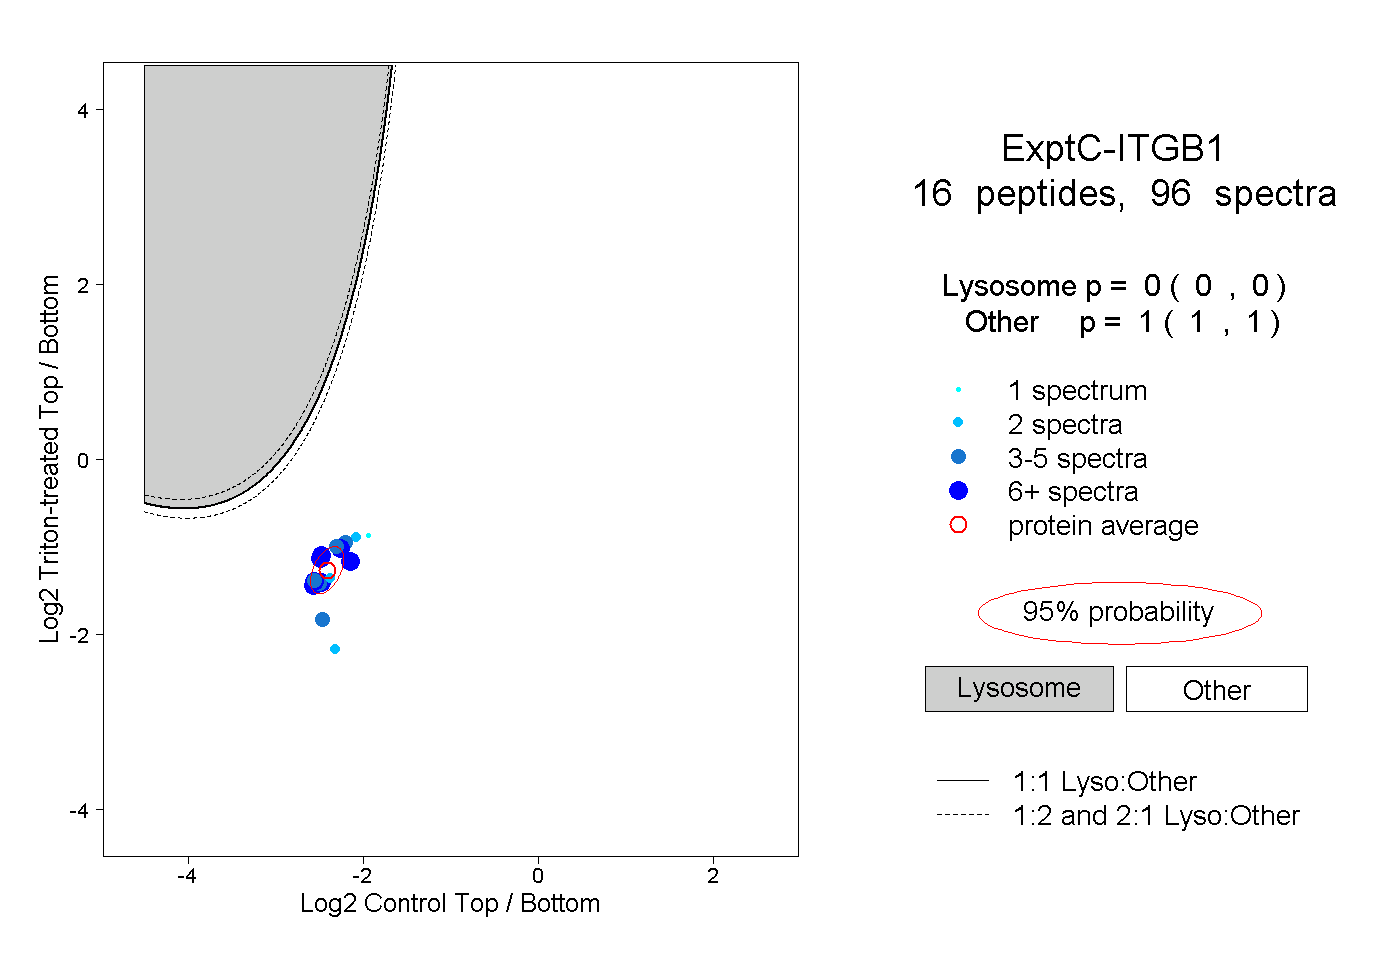 |
0.000 0.000 | 0.000 |
1.000 1.000 | 1.000 |
||||||||
| Plot | Lyso | Other | |||||||||||
| Expt D |
4 peptides |
7 spectra |
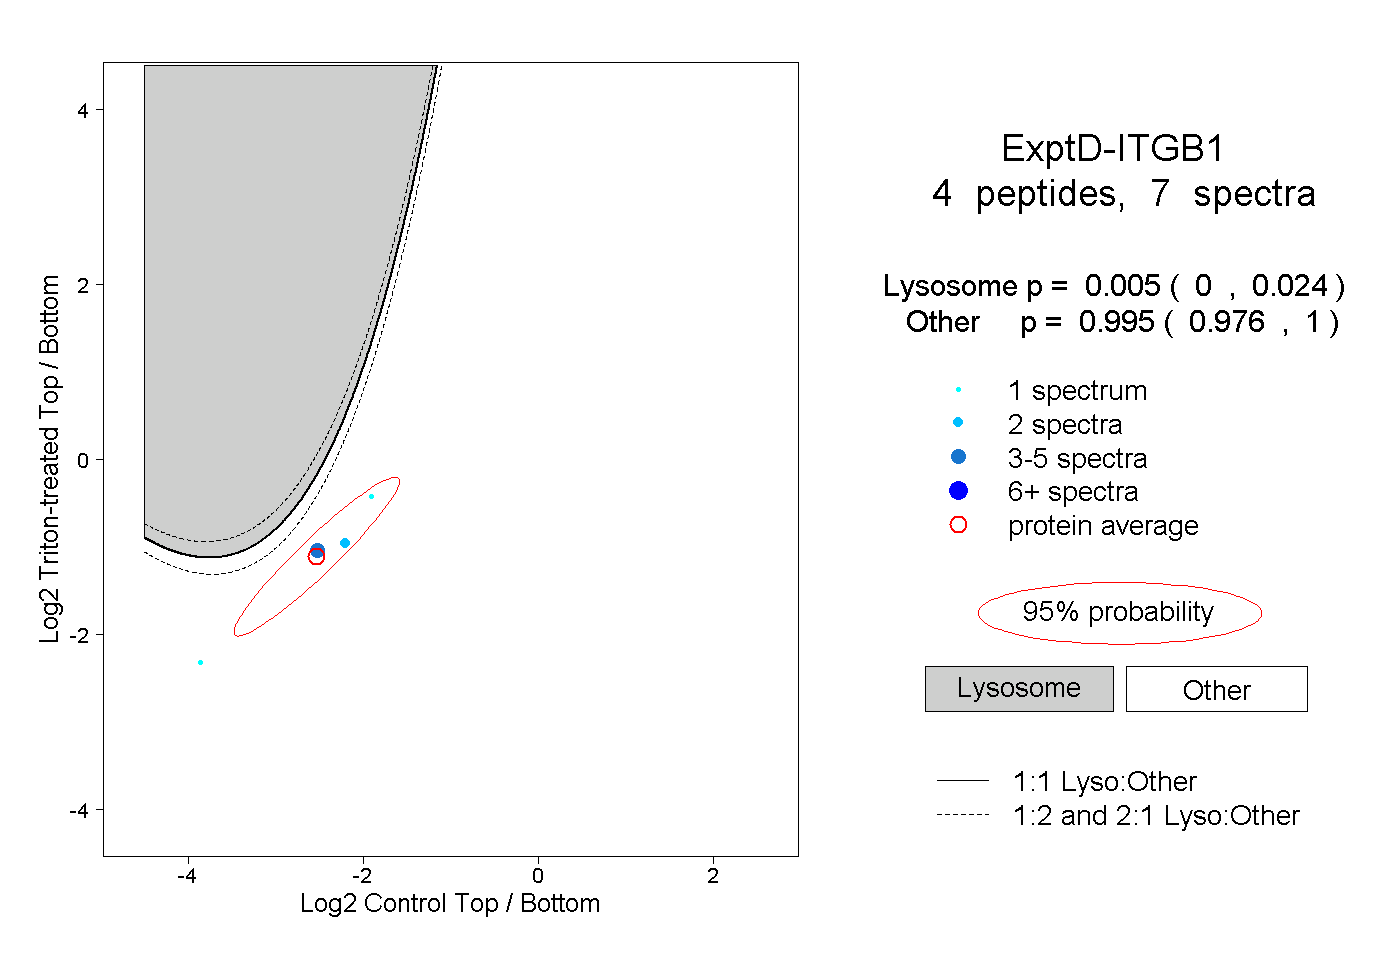 |
0.005 0.000 | 0.024 |
0.995 0.976 | 1.000 |